[想定している読者像]
事業会社ののマーケターの方。特にECのような非契約型(つまり解約などがない)タイプの商材を扱う企業様。事業会社のマーケテイング系のデータサイエンティストの方。
[コンテンツ属性]
ビジネス:★★★☆☆
データアナリティクス:★★★★★
エンジニアリング:★☆☆☆☆
以前もこちらの記事でカスタマーライフタイムバリュー(CLV)について解説記事を書きました。本稿は商材の中でも特にCLVの予測が難しい「非契約型商材」のCLVの算出に関して解説しています。
CLV概要
Customer Lifetime Value(CLV)は顧客が生涯に渡ってある企業に支払う価値の総和です。
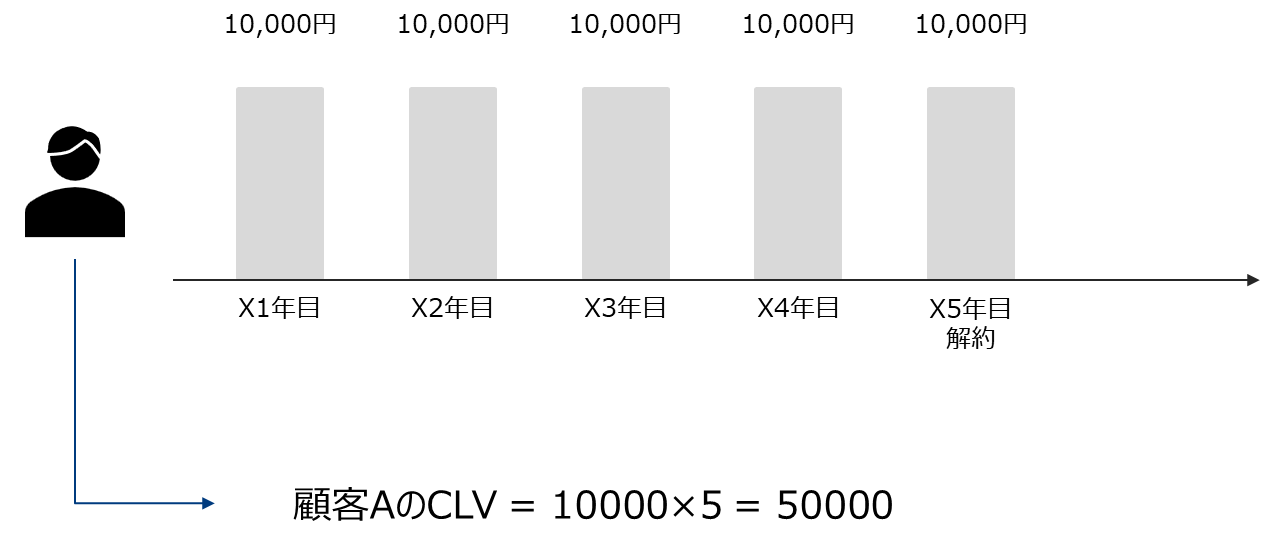
以前はLTVと略することが多かったのですが、最近はCLVとすることの方が多いようです。
CLVは生涯価値であるため、未観測事象に対する予測が必要です。
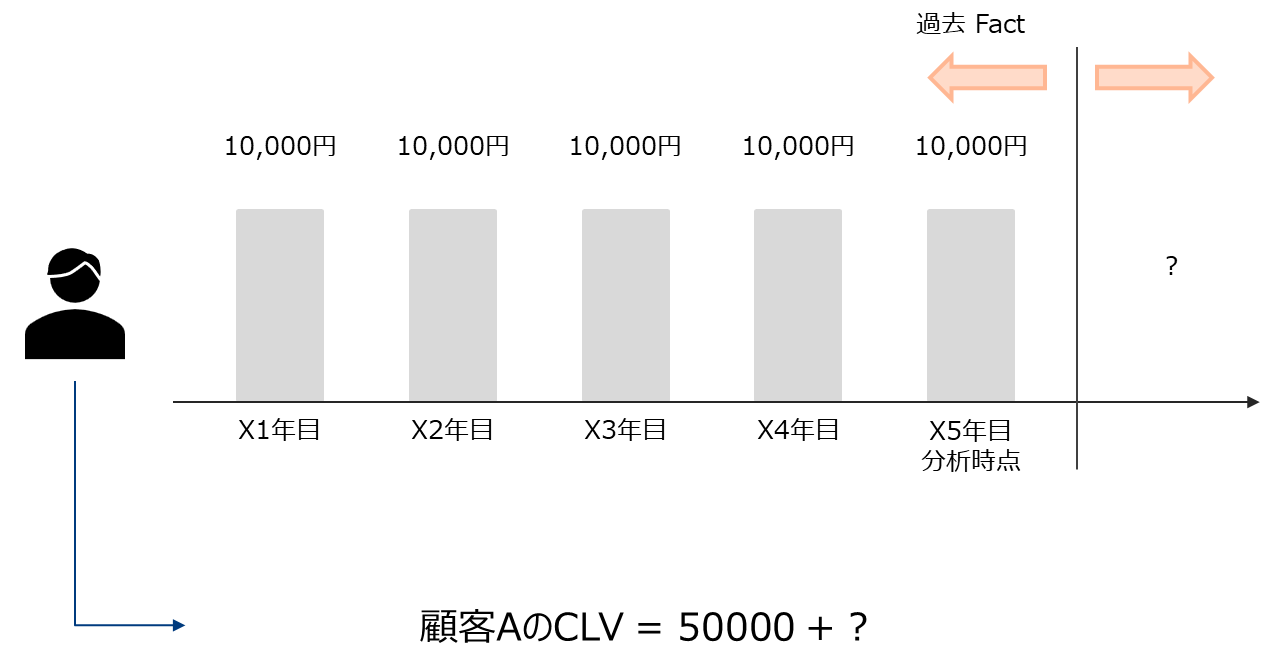
以下の例で具体的なイメージを掴みます。
CLVの例
スマートフォンの売上(あるキャリア)
2年で更新するものとする。月の売上を10,000円とする。更新率を75%とする。10年で更新終了とする。(つまり4回更新する)

LTV = 10000*12*2+0.75*10000*12*2+…+0.75^(4)*10000*12*2 = 24000 + 18000 + 13500 + 10125 + 7593.75 = 73218.75円
トイレットペーパーの売上(ブランド横断)
1家庭2日で1ロール消費するとする。6ロール入り600円とする。30年間消費するとする。一日あたりの金額 = 600/(2*6) = 50として、LTV = 50*365*30 = 547,500円
CLVの活用
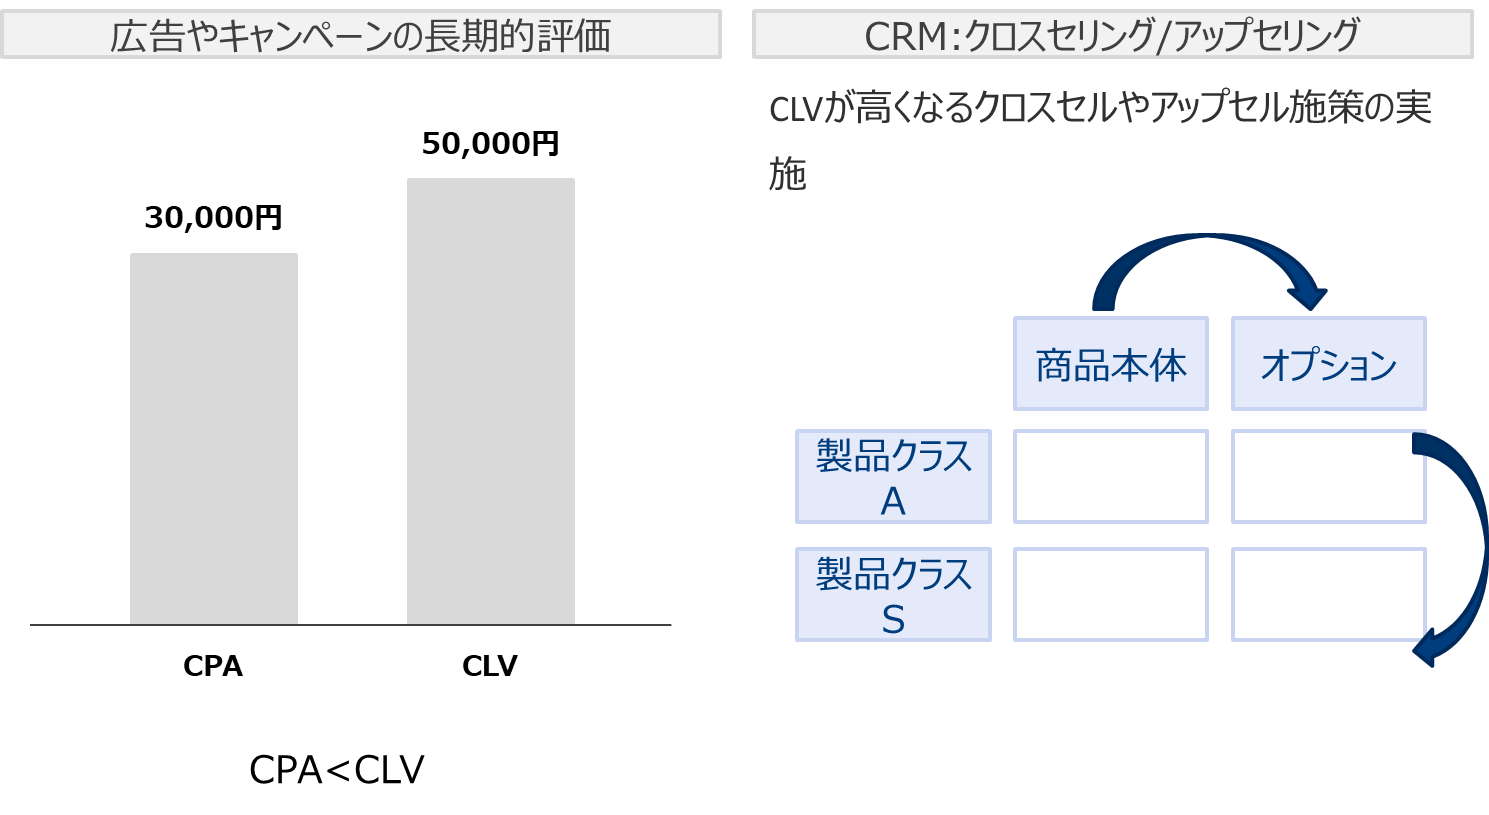
マーケティングにおいて長期的な指標として重要です。
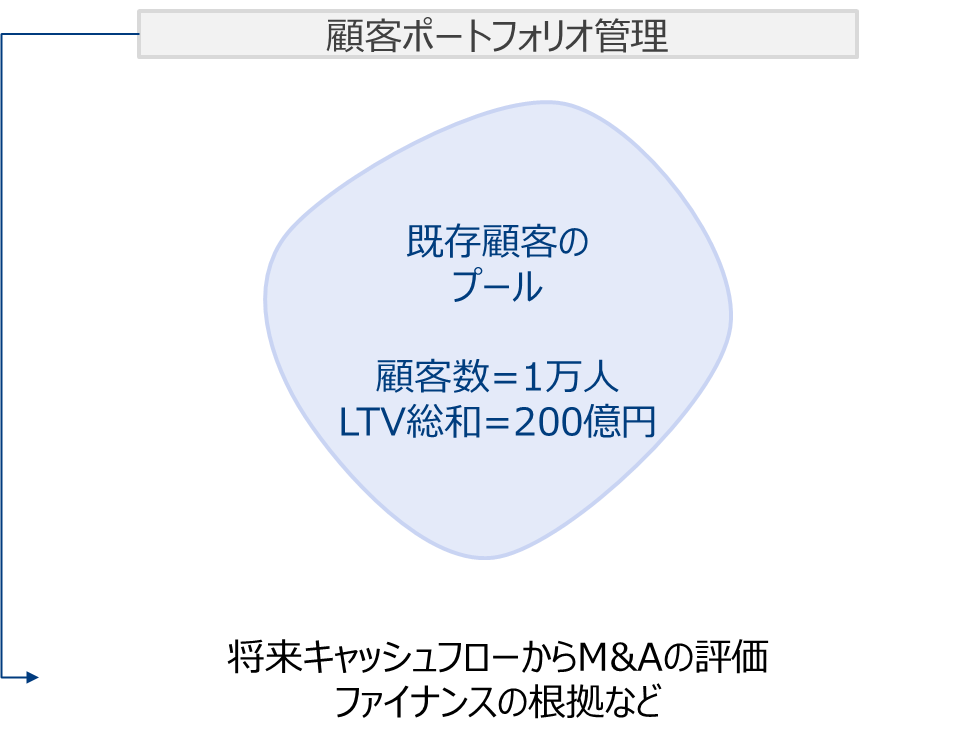
最近ではCLVで顧客ポートフォリオの評価を行いファイナンスに活用するなどのアイデアも考えられているようです。
予測
予測CLVは一般的にt時点の売上関数S(t)の総和として書けます。
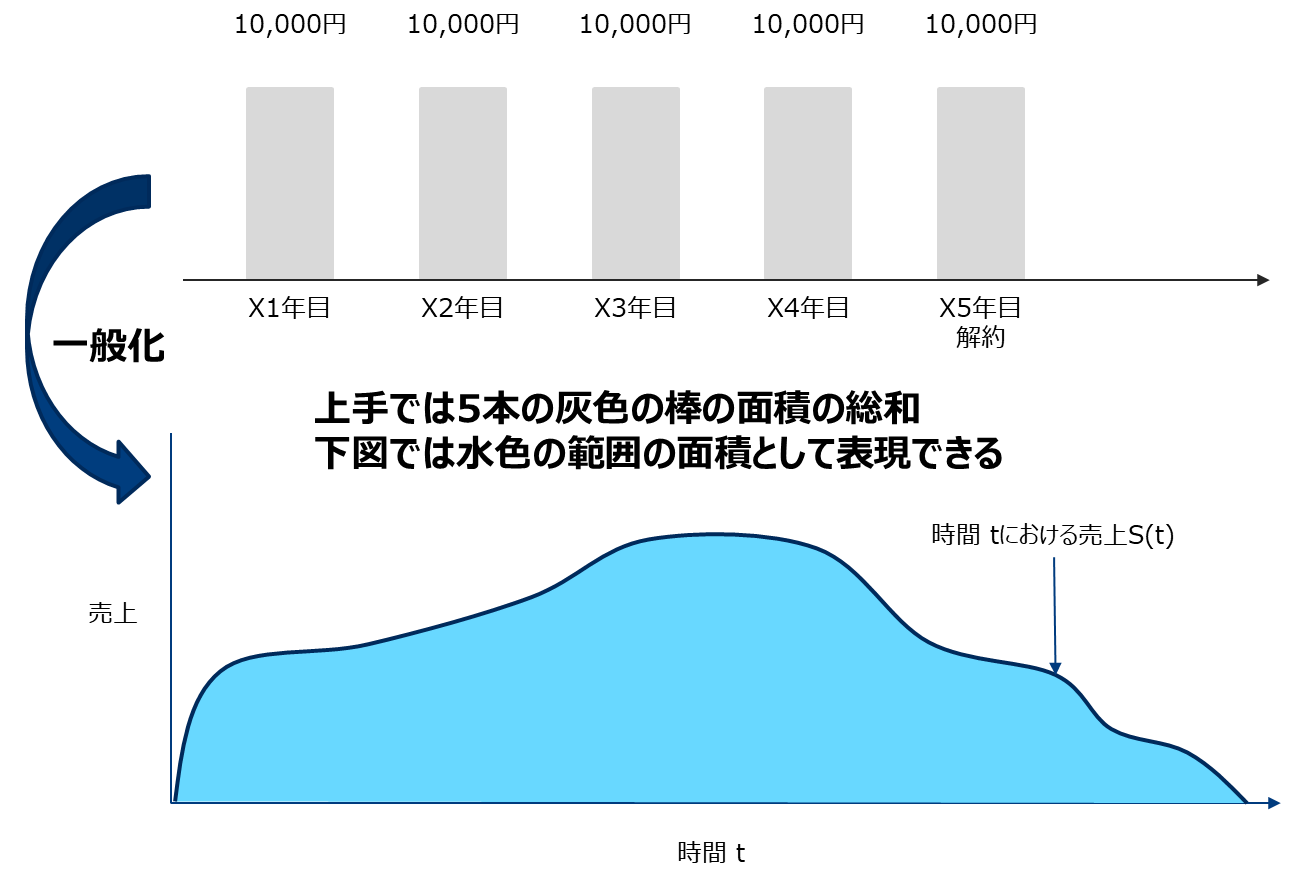
S(t)を記述することは難しいため、簡単な仮定を置き以下の式で定義します。
- 顧客Aの予測CLV = 1期目予測購買額 + 2期目予測購買額 × 1期目継続率 +
+3期目予測購買額× 2期目継続率 …
+n期目予測購買額 × n-1期目継続率 → 予測購買額を一定と仮定して - 顧客Aの予測CLV = 予測購買額 × (1 + 1期目継続率 + 2期目継続率 +…+ n-1期目継続率) → 継続率を一定として
- 顧客Aの予測CLV = 予測購買額 × (継続率^(0) + 継続率^(1) + 継続率^(2) +…+継続率^(n-1)) → 等比級数の公式を適用して
- 顧客Aの予測CLV = 予測購買額 × {1-継続率^(n)} / (1-継続率) → n→∞として
- 顧客Aの予測CLV = 予測購買額 × 1 / (1-継続率)
となります。つまり以下のように簡便な式で表せます。

CLVを大きくするには「購買単価を上げる or 購買回数を上げる or 継続率を上げる」という自明なことが式から示されます。つまりこの定義式は妥当とえいます。
商材の分類
購買単価、回数、継続率を算出する方法は商材によりことなります。
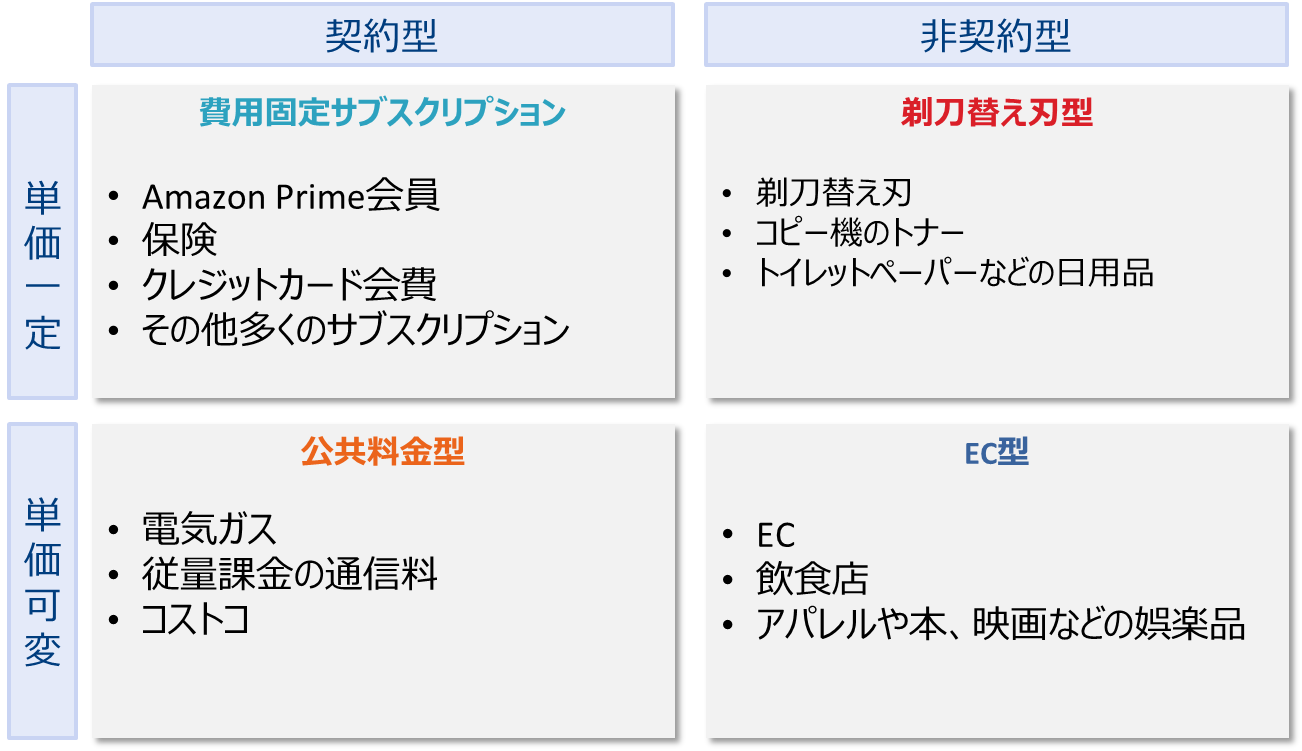
購買単価などの推定難易度も異なります。
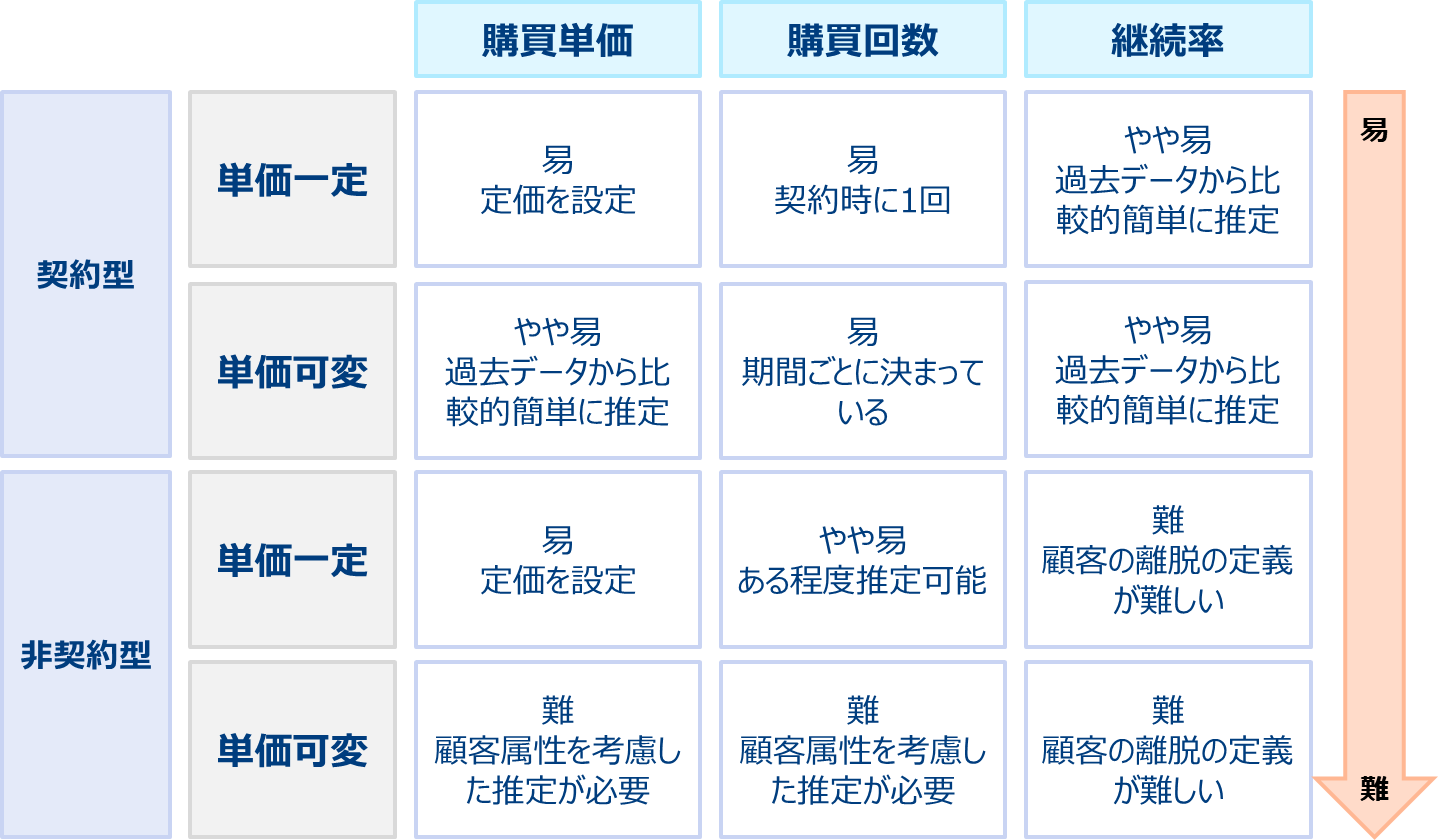
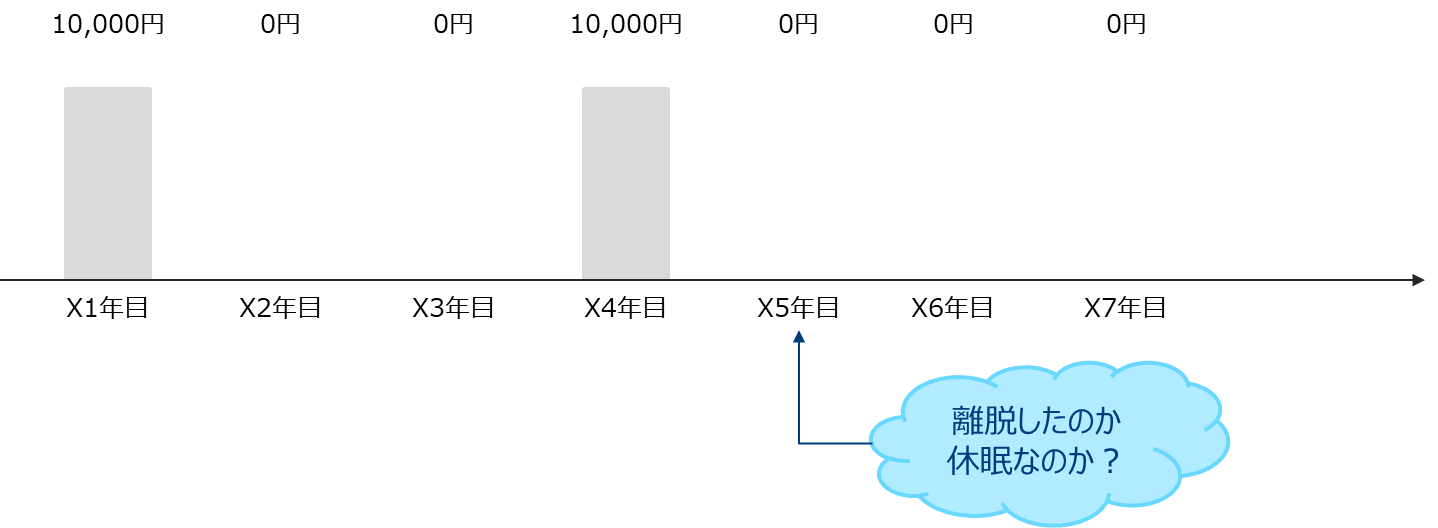
非契約型商材は明確な離脱が観測できないためCLVの計算が困難です。
非契約型商材に対してのCLV推定方法のフレームワークとして「Buy Till you Die」 (死までの購買) モデルというものがあります。
- 生存率とリピート購買数をそれぞれモデル化する
- 購買単価を上記2つとは別にモデル化する
- それらを掛け合わせCLVを求める
lifetimes パッケージ
pythonのLifetimesパッケージはBuy Till you Dieモデルを用いたCLV推定を行うパッケージです。
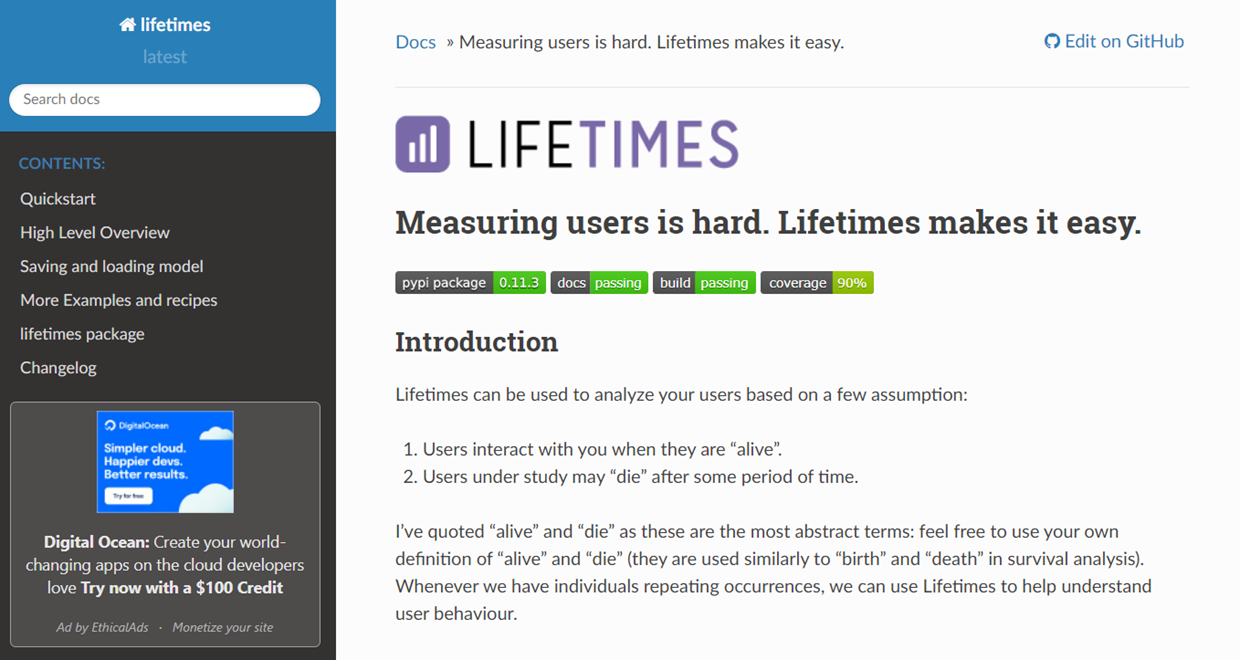
https://lifetimes.readthedocs.io/en/latest/index.html
Lifetimes パッケージは以下の考え方にもとづきます。
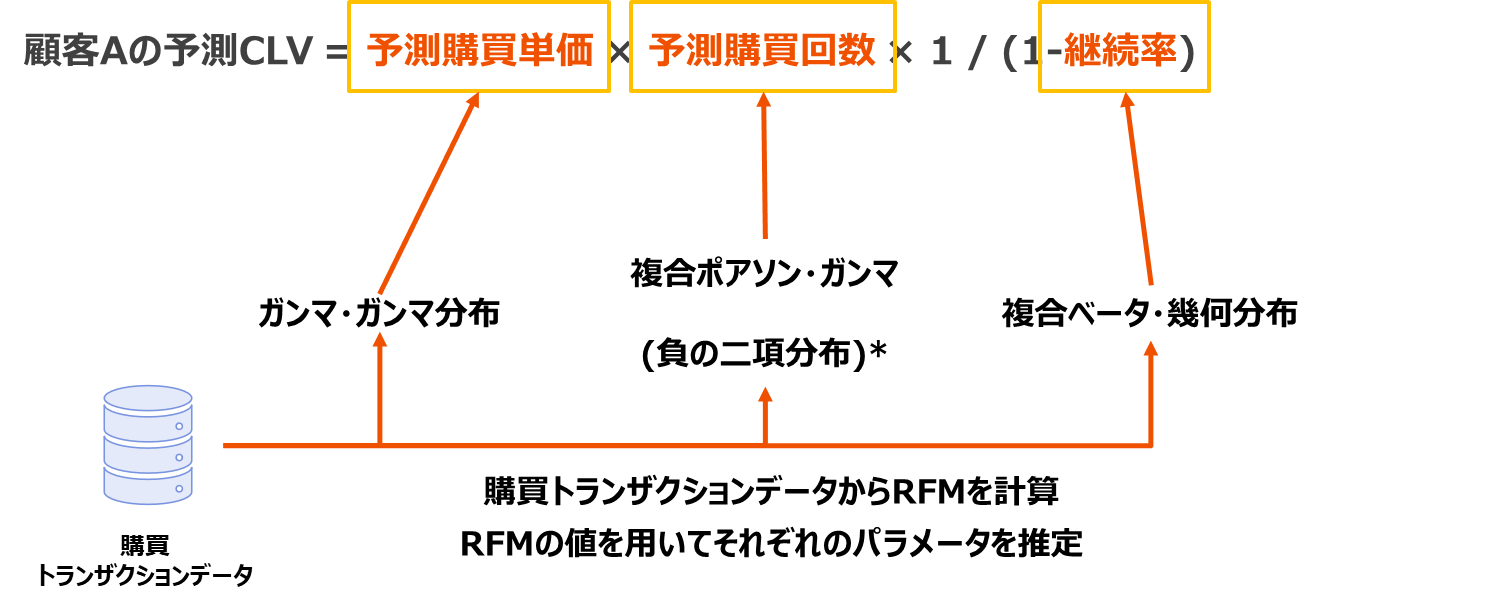
* ポアソン分布のパラメータλがΓ(r,α)分布に従うと、λで積分すると負の二項分布になる。1興味ある方はhttps://www.slideshare.net/simizu706/ss-50994149 https://timothy-barry.github.io/posts/2020-06-16-gamma-poisson-nb/を参照
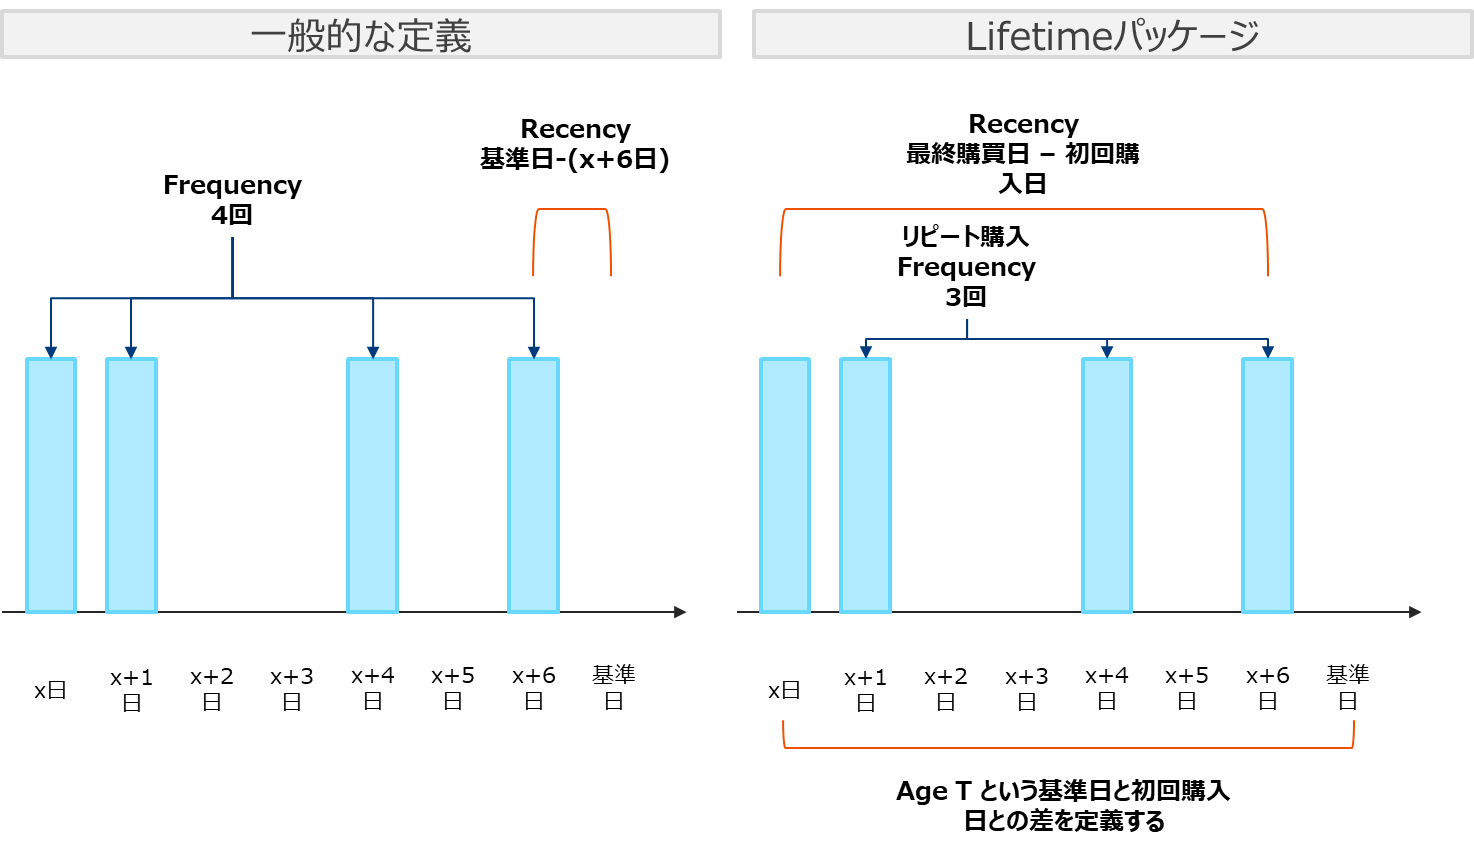
lifetimesパッケージでは一般的な定義と異なるRFを使用します。
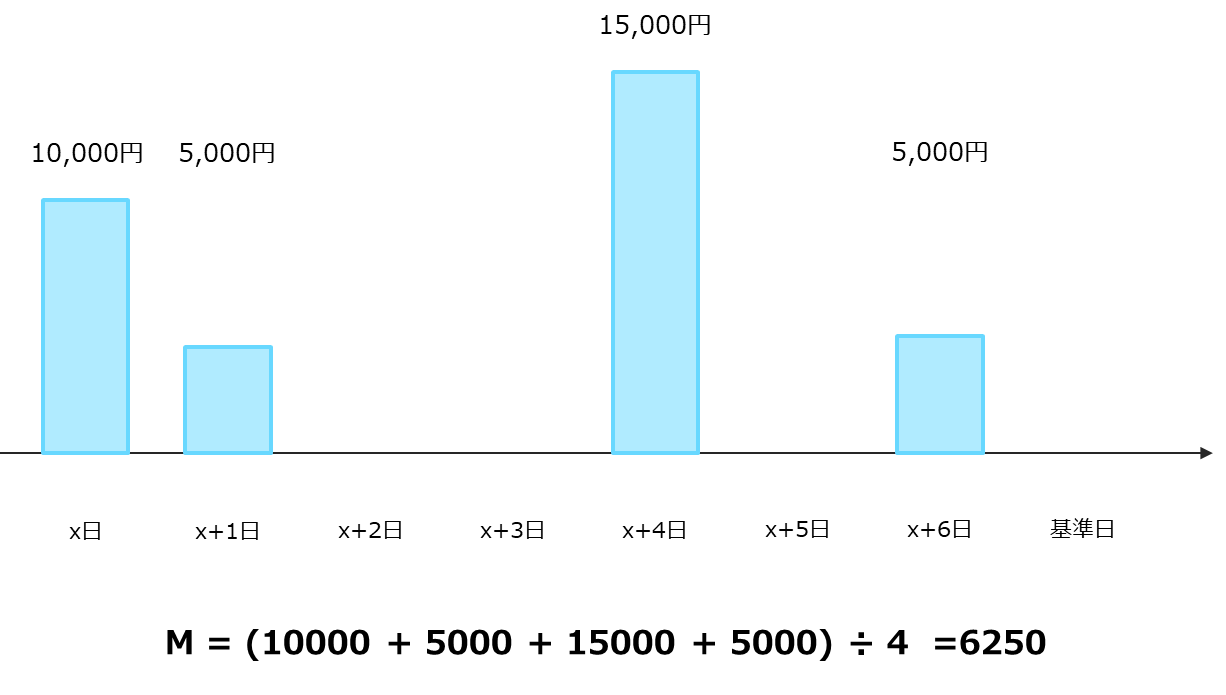
M (Monetary)の定義は様々ありますが、lifetimesパッケージでは購買があった1単位時間あたり (先の例では1日あたり) の平均購買金額を用います。
トランザクションデータをRFM(T)の形に変形したものを使用します。
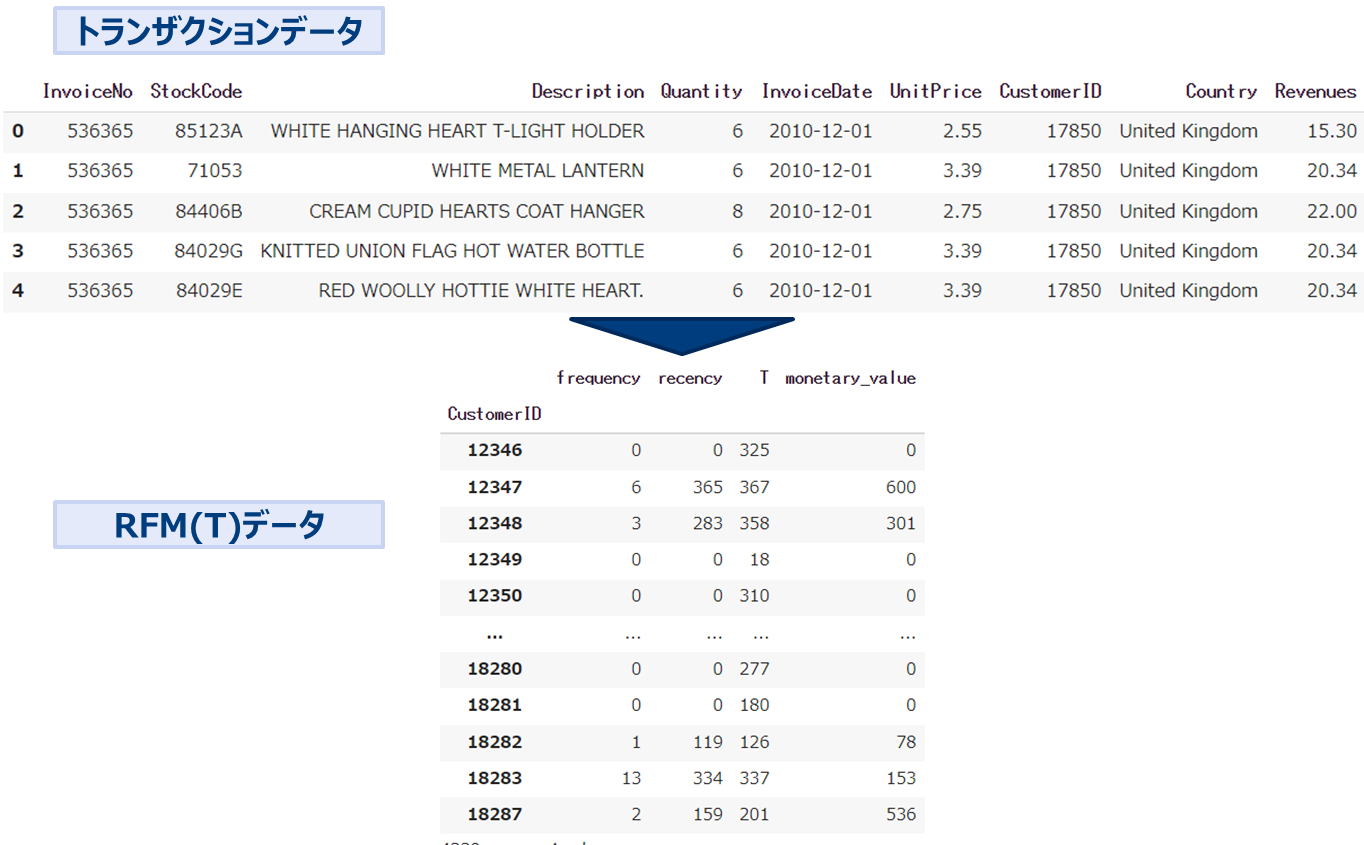
* 上記データはUC Irvine Machine Learning Repository 「Online Retail」 data https://archive-beta.ics.uci.edu/ml/datasets/online+retail
lifetimes パッケージ 実践
UCI 「Retail Online」データを用いたCLV算出のプロセスを実践します。以降は「https://towardsdatascience.com/buy-til-you-die-predict-customer-lifetime-value-in-python-9701bfd4ddc0 」の内容やコードを参考にしています。
データのダウンロードとgoogle coloboratoryの環境設定を行います。
まずはじめにデータをDLとし、google drive上において当該driveをcoloboratoryからマウント(使用できるように)します。
- https://archive-beta.ics.uci.edu/ml/datasets/online+retail よりDLする。
- DLしたCSVをGoogle driveの適当な場所におく。
- Google coloboratory から以下を実行する。
from google.colab import drive
drive.mount('/content/drive')
lifetimesパッケージのインストールと関連ライブラリのimportを行います。
!pip install lifetimesimport numpy as np
import pandas as pd
import matplotlib.pyplot as plt
from datetime import timedelta
import seaborn as sns
import os
from sklearn.metrics import mean_absolute_percentage_error
from lifetimes import BetaGeoFitter, GammaGammaFitter
from lifetimes.utils import calibration_and_holdout_data, summary_data_from_transaction_data, calculate_alive_path
from lifetimes.plotting import plot_frequency_recency_matrix, plot_probability_alive_matrix, plot_period_transactions, \
plot_history_alive, plot_cumulative_transactions, plot_calibration_purchases_vs_holdout_purchases, plot_transaction_rate_heterogeneity, plot_dropout_rate_heterogeneity
import warnings
warnings.filterwarnings('ignore')
os.chdir(‘/content/drive/My Drive/[先ほどのファイルを置いた場所]')
print (os.getcwd())データの読み込みと中身を確認します。
# データ読み込み
df0 = pd.read_excel("Online Retail.xlsx")
# 中身確認
display (df0.head())
欠損除去などのデータクリーニングを行います。
# 欠損確認
df0.isnull().sum()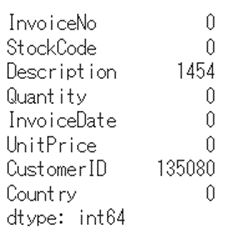
# CustomerIDがないユーザのレコードを落とす
df1 = df0.copy()
df1 = df1[pd.notnull(df1["CustomerID"])]
# 返品レコードを除く (Quantity<=0除く)
df1 = df1[df1["Quantity"] > 0]
# datetimeから日時抜き出す
df1["InvoiceDate"] = pd.to_datetime(df1["InvoiceDate"]).dt.date #normalize()
# object型に変換
df1["CustomerID"] = df1["CustomerID"].astype(np.int64).astype(object)
# 確認
df1.describe(include='object').T単価と数量を乗して収益を算出します。
# 収益変数作成 revenues = quantity * unitprice
df1["Revenues"] = df1["Quantity"] * df1["UnitPrice"]
df1.head()
具体例でRFを確認してみます。
# (例) RFの参考値
# recency, frequency, T
dfx = df1[df1["CustomerID"] == 14527]
xmax_date = dfx["InvoiceDate"].max()
xmin_date = dfx["InvoiceDate"].min()
# recency:
print("customer minimum date:", xmin_date)
print("customer maximum date:", xmax_date)
xrec = (xmax_date - xmin_date).days
print("recency:", xrec)                                    # recency = time span between first and last purchase
# age T:
xmaxall_date = df1["InvoiceDate"].max()
print("population maximum date:", xmaxall_date)
xage = (xmaxall_date - xmin_date).days                    # age T
print("T:", xage)
# frequency:
xfreq = len(dfx[dfx["Quantity"] > 0].groupby("InvoiceDate"))-1    # frequency: periods with repeat purchases
print("frequency:", xfreq)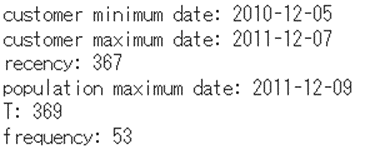
トランザクションデータをRFMデータに変換します。
# determine recency, frequency, T, monetary value for each customer
df_rft = summary_data_from_transaction_data(
    transactions = df1,
    customer_id_col = "CustomerID",
    datetime_col = "InvoiceDate",
    monetary_value_col = "Revenues",
    observation_period_end = max_date,
    freq = "D")
pd.options.display.float_format = '{:,.0f}'.format
df_rft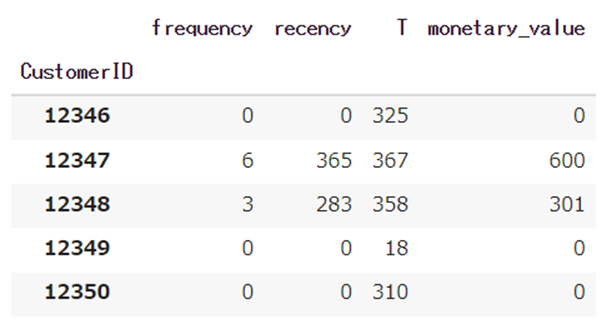
RFとTの分布を確認します。
# axis length
max_freq = df_rft["frequency"].quantile(0.98)
max_rec = df_rft["recency"].max()
max_T = df_rft["T"].max()
# frequency
fig = plt.figure(figsize=(8, 4))
ax = sns.distplot(df_rft["frequency"])
ax.set_xlim(0, max_freq)
ax.set_title("frequency (days): distribution of the customers");
# recency
fig = plt.figure(figsize=(8, 4))
ax = sns.distplot(df_rft["recency"])
ax.set_xlim(0, max_rec)
ax.set_title("recency (days): distribution of the customers")
# T
fig = plt.figure(figsize=(8, 4))
ax = sns.distplot(df_rft["T"])
ax.set_xlim(0, max_T)
ax.set_title("customer age T (days): distribution of the customers")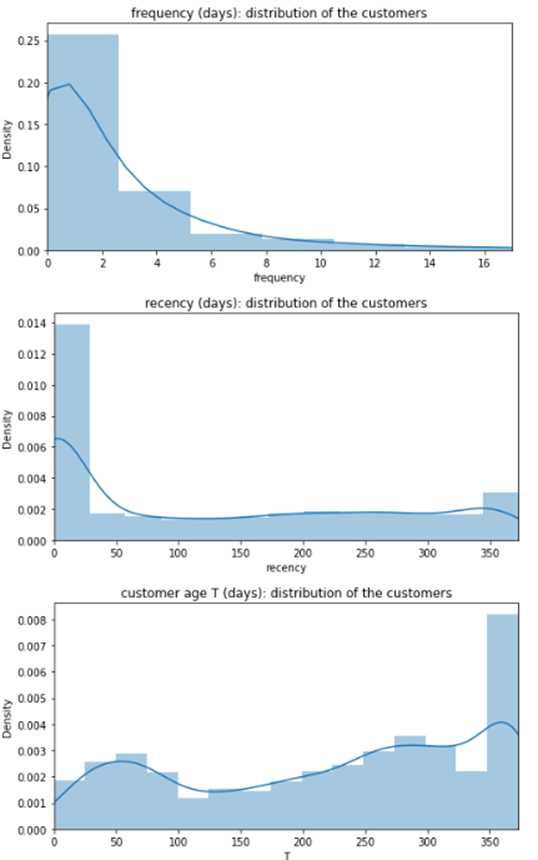
購買回数と継続率のモデリングを行います。

# BG/NBD model
bgf = BetaGeoFitter(penalizer_coef=1e-06)
bgf.fit(
        frequency = df_rft["frequency"],
        recency = df_rft["recency"],
        T = df_rft["T"],
        weights = None,
        verbose = True,
        tol = 1e-06)
pd.options.display.float_format = '{:,.3f}'.format
bgf.summary
購買数の予測値と実績値を比較します。
# 検証
# frequency of repeat transactions: predicted vs actual
fig = plt.figure(figsize=(12, 12))
plot_period_transactions(
            model = bgf,
            max_frequency = 10);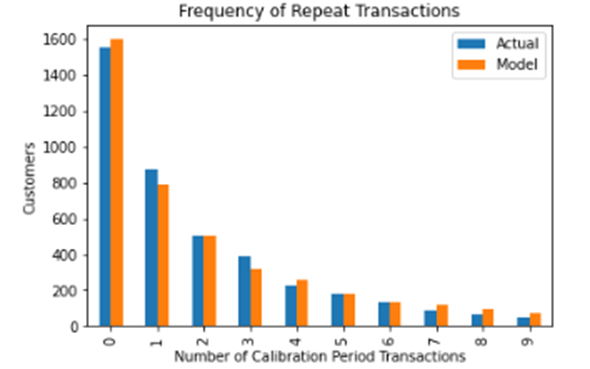
現時点からt期間後の予測購買数の分布を確認します。
#axis length
max_freq = int(df_rft["frequency"].max())  #quantile(0.95))
max_T = int(df_rft["T"].max())
max_rec = int(df_rft["recency"].max())
t = 10
fig = plt.figure(figsize=(7, 7))
plot_frequency_recency_matrix(
        model = bgf,
        T = t,
        max_frequency = max_freq,
        max_recency = max_rec)
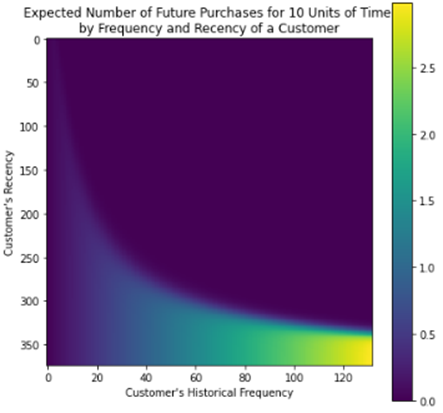
継続率の分布を確認します。
# probability that a customer has not churned (= is alive), based on
# customer's specific recency r and frequency f
fig = plt.figure(figsize=(7, 7))
plot_probability_alive_matrix(
            model = bgf,
            max_frequency = max_freq,
            max_recency = max_rec);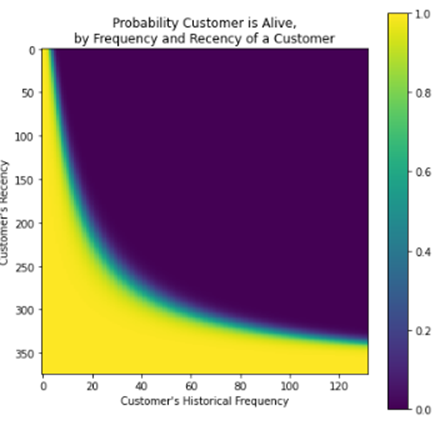
ある特定のユーザの継続率の推移を確認します。
# select a customer
custID = 15107
df1C = df1[df1["CustomerID"] == custID]
span_days = 365*2
# history of the selected customer: probability over time of being alive
fig = plt.figure(figsize=(20,4))
print("customer",custID,": probability of being alive over time")
plot_history_alive(
                    model = bgf,
                    t = span_days,
                    transactions = df1C,
                    datetime_col = "InvoiceDate");
予測購買単価(日次単価)のモデリングを行います。

購買額には以下の仮定を置きます。
- 顧客ごとに購買額の平均は異なる
- 但しその平均額は時間によらない、その平均額を中心に分布する
事前準備を行います。
データの加工
# monetary value > 0 のものを抽出
df_rftv = df_rft[df_rft["monetary_value"] > 0]
pd.options.display.float_format = '{:,.2f}'.format
df_rftv.describe()
Monetaryとfrequencyは独立であることを仮定するため相関係数を確認する
# Gamma-Gamma model は frequencyとmonetary valueの相関係数が0に近いことが必要
corr_matrix = df_rftv[["monetary_value", "frequency"]].corr()
corr = corr_matrix.iloc[1,0]
print("Pearson correlation: %.3f" % corr)
モデリングを行い、パラメータを推定します。
# fitting the Gamma-Gamma model
ggf = GammaGammaFitter(penalizer_coef = 1e-06)
ggf.fit(
        frequency = df_rftv["frequency"],
        monetary_value = df_rftv["monetary_value"],
        weights = None,
        verbose = True,
        tol = 1e-06,
        q_constraint = True)
pd.options.display.float_format = '{:,.3f}'.format
ggf.summary
購買額、購買回数、継続率を付与して確認します。
# 予測購買回数付与
def predict_purch(df, t):
        df["predict_purch_" + str(t)] = \
                bgf.predict(
                    t,
                    df["frequency"],
                    df["recency"],
                    df["T"])


# call helper function: predict each customer's purchases over multiple time periods
t_FC = [10, 30, 60, 90]
_ = [predict_purch(df_rft, t) for t in t_FC]
pd.options.display.float_format = '{:,.1f}'.format
print("predicted number of purchases for each customer over next t days:")
df_rft
# 予測継続率付与
prob_alive = bgf.conditional_probability_alive(
frequency = df_rft["frequency"],
recency = df_rft["recency"],
T = df_rft["T"])
df_rft["prob_alive"] = prob_alive
pd.options.display.float_format = '{:,.2f}'.format
df_rft.describe()# 予測購買額付与
exp_avg_rev = ggf.conditional_expected_average_profit(
df_rftv["frequency"],
df_rftv["monetary_value"])
df_rftv["exp_avg_rev"] = exp_avg_rev
df_rftv["avg_rev"] = df_rftv["monetary_value"]
df_rftv["error_rev"] = df_rftv["exp_avg_rev"] - df_rftv["avg_rev"]
mape = mean_absolute_percentage_error(exp_avg_rev, df_rftv["monetary_value"])
print("MAPE of predicted revenues:", f'{mape:.2f}')
pd.options.display.float_format = '{:,.3f}'.format
df_rftv.head()
CLVを計算します。
# CLVを計算する
DISCOUNT_a = 0                # 年間割引率 ここでは0でよい
LIFE = 12                        # 12か月後のCLV
clv = ggf.customer_lifetime_value(
        transaction_prediction_model = bgf,
        frequency = df_rftv["frequency"],
        recency = df_rftv["recency"],
        T = df_rftv["T"],
        monetary_value = df_rftv["monetary_value"],
        time = LIFE,
        freq = "D",
        discount_rate = DISCOUNT_a)
df_rftv.insert(0, "CLV", clv)             # expected customer lifetime values
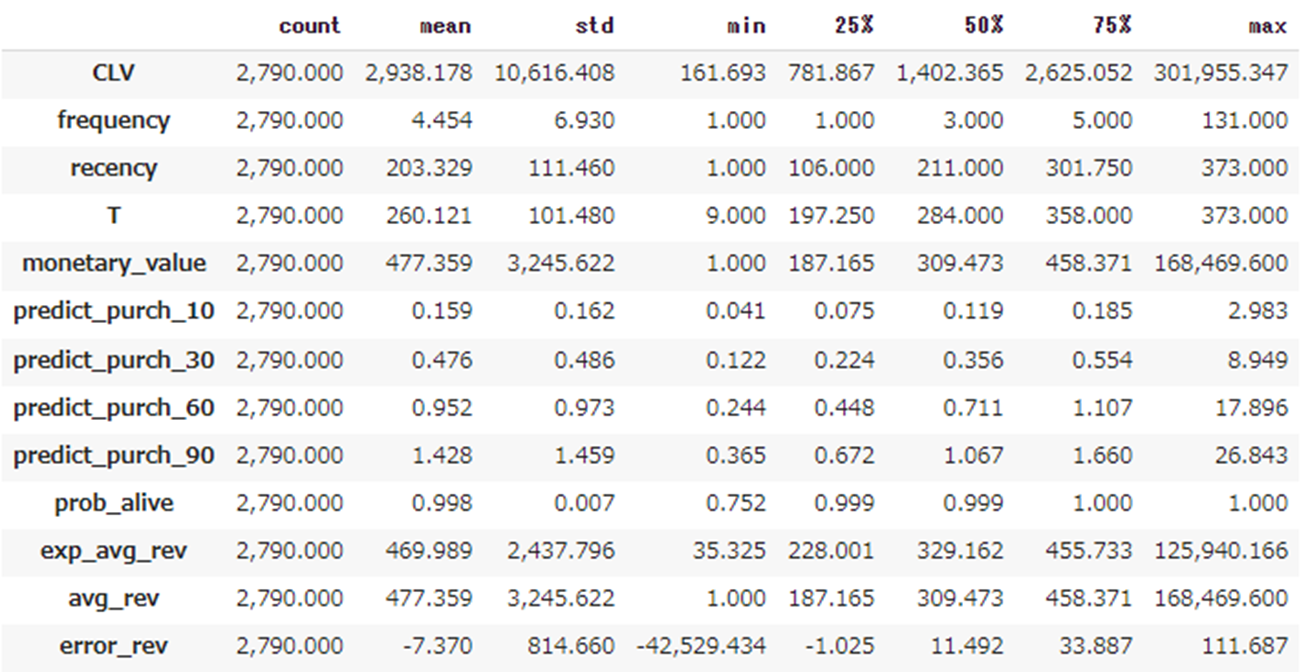
df_rftv.describe().T
翌12か月分の推定CLVの平均は2938.178£(日本円で467333.37円、つまり1000人の顧客がいれば翌12か月に約5億円の収益が見込める)
CLVの分布を確認します。
plt.hist(df_rftv['CLV'],bins=1000)
plt.xlim(0,30000)
plt.grid(True)
plt.title('Predict CLV ')
# MとCLVの関係
fig, axes = plt.subplots(1,2,figsize=(14,7))
axes[0].scatter(df_rftv['monetary_value'],df_rftv['CLV'])
axes[0].set_title('M * CLV')
# FとCLVの関係
axes[1].scatter(df_rftv['frequency'],df_rftv['CLV'])
axes[1].set_title('F * CLV')
長々とお付き合いありがとうございました。
ECサイトなどの離脱が明確に観測できない商材に対して有効な力を発揮します。
無料相談大歓迎です。ご興味ございましたら、お問い合わせはこちらから宜しくお願い致します。

