[想定している読者像]
構築した機械学習モデルの運用定義をしたい方。
MLOpsに興味のあるデータエンジニア、データサイエンティストの方。
[コンテンツ属性]
ビジネス:★☆☆☆☆
データアナリティクス:★★★☆☆
エンジニアリング:★★★★☆
1. Kedro概要
1.1 Kedroとは
KedroはMLOpsを支援するpythonベースのツールであり、McKinseyが2015に買収したデータアナリティクスファーム「QuantumBlack」が開発したもので、データパイプラインを構築するためのフレームワークを提供するPythonライブラリです。1公式HP https://kedro.org/
1.2 MLOps
MLOpsは機械学習の円滑な運用を目指す活動及び基盤の総称とされています。
ML Opsは、機械学習、DevOps、データエンジニアリングを組み合わせた一連のプラクティスであり、機械学習を信頼性高くかつ効率的に実装し・維持することを目的とするもの
「ML Ops: Machine Learning as an Engineering Discipline」 https://towardsdatascience.com/ml-ops-machine-learning-as-an-engineering-discipline-b86ca4874a3f
機械学習オペレーション「MLOps」は、拡大を続ける種々のソフトウェア製品やクラウド サービスを活用して企業が AI 運用を成功させるためのベスト プラクティス
(*2 Nvidia blog 日本語翻訳版) https://blogs.nvidia.co.jp/2020/09/29/what-is-mlops/
1.3 MLOpsツール
MLOpsツールは主にpipelineを構築管理できるもので、様々なものがリリースされています。
- Kubeflow…GCPのVertex AIからSDKを利用可能。
- MLflow…OSSの機械学習管理ツール
- Metaflow…NetFlix作成ツール
- Kedro…マッキンゼーのデータ解析部隊(Quantum black)が作成したpythonベースのパイプラインツール
表題の通り、本稿では特にKedroにフォーカスします。
1.4 Kedroの特徴
pipelineの可視化
- ブラウザベースでpipelienを可視化するkedro-vizプラグイン。
- データの結合や加工、実験結果のトレースが可能。
Data Catalog
- 要するにデータコネクトを持つ。
- ローカルファイルだけではなく、S3やGCSなどのクラウドサービス上のデータも直接read/write可能。
- モデルの保存や、そのバージョン管理も可能
プロジェクトテンプレート
- 階層構造を持つテンプレートを利用する。
- このため設定やデータ、及びコードなどを一元に管理でき、かつ他人の作業場所でもプロジェクトの再現が容易。
1.5 どのようなときに便利か?
① 可視化
データの加工の流れを可視化することは、データを正確に理解するために不可欠です。また、ステークホルダーやインフラとのすり合わせなどに使用します。
② 実験
実験のパラメータを別に持たせることが可能であるため、パラメートを変えながら実験を行うのが容易です。同様にデータもcatalogで指定を変え、同じ処理を流すなどができます。
③ 引継ぎ
再現性を保ったまま、第3者への引継ぎが容易。プロジェクトの第2phaseなどで、第1phaseのテンプレートをそのまま拡張していく形で使用できます。
以降では公式チュートリアルをなぞりながら使い方を解説します。
2. 実践
2.1 環境構築
anacondaはインストールしてあるものとします。anacondaを起動し以下のように環境を準備します。
conda create --name kedro-test python=3.10 -y
conda activate kedro-test
pip install kedro
以降の作業はご自身の適当な作業フォルダで行います。cd [適当な作業フォルダ]でanaconda上で移動しておきます。
ただし新しくkedroのための環境を作成するよりは、既存の分析環境をコピーし、そこにkedroをinstallした方がライブラリの依存性の問題で躓くことは少ないかも。
補足
- parquetのエラーが出る場合は pip isntall kedro[pandas]
2.2 プロジェクト作成
kedro チュートリアルのspaceflightsプロジェクトで行います。2https://docs.kedro.org/en/stable/tutorial/spaceflights_tutorial.html

架空の2160年が舞台です。スペースシャトルの往復便の価格を予測するモデルを作成します。
newコマンドでプロジェクトを作成します。kedroはプロジェクト1つにつき1つのテンプレート(階層構造を持つフォルダ群)が対応します。
kedro new上記を入力すると以下のようにプロジェクト名を聞かれるため、任意の名前を入力します。

するとカレントディレクトリにプロジェクト名のフォルダができます。ここではプロジェクト名を公式チュートリアル通り[spaceflights]とします。
できたプロジェクトフォルダに移動します。
cd spaceflightsフォルダは以下のような階層構造を持つテンプレートになっています。
C:.
├─conf
│  ├─base
│  └─local
├─data
│  ├─01_raw
│  ├─02_intermediate
│  ├─03_primary
│  ├─04_feature
│  ├─05_model_input
│  ├─06_models
│  ├─07_model_output
│  └─08_reporting
├─docs
│  └─source
├─logs
├─notebooks
└─src
    ├─spaceflights
    │  └─pipelines
    └─tests
        └─pipelines
2.3 必要なライブラリをインストール
spaceflights/src/requirements.txtを使用し、必要ライブラリをインストールします。ここではメモ帳でrequirements.txt開き以下のように編集します。
# code quality packages
black~=22.0
flake8>=3.7.9, <5.0
ipython>=7.31.1, <8.0
isort~=5.0
nbstripout~=0.4

# notebook tooling
jupyter~=1.0
jupyterlab~=3.0
jupyterlab_server>=2.11.1, <2.16.0

# Pytest + useful extensions
pytest-cov~=3.0
pytest-mock>=1.7.1, <2.0
pytest~=7.2

# Kedro dependencies and datasets to work with different data formats (including CSV, Excel, and Parquet)
kedro~=0.18.7
kedro-datasets[pandas.CSVDataSet, pandas.ExcelDataSet, pandas.ParquetDataSet]~=1.1
kedro-telemetry~=0.2.0
kedro-viz~=5.0 # Visualise pipelines

# For modelling in the data science pipeline
scikit-learn~=1.0
としています。
編集済のファイルを閉じて以下のコマンドをanacondaプロンプトから打ち込みます。
pip install -r src/requirements.txt2.4 データのセットアップ
ローデータのCSVやExcelなどは、[プロジェクト名フォルダルート]/data/01_raw/に配置します。この例では、以下のファイルをhttps://github.com/kedro-org/kedro-starters/tree/main/spaceflights/{{ cookiecutter.repo_name }}/data/01_rawからダウンロードし、当該フォルダに配置します。
- companies.csv
- reviews.csv
- shuttles.xlsx
次に、上記データセットを登録します。
登録方法は、[プロジェクト名フォルダルート]/conf/base/catalog.ymlを開き、指定された方法で記述します。データセットの種類によって、若干記述方法が異なります。以下はCSVの場合の記述方法です。ファイルタイプとファイルの場所のパスを記述します。
companies:
	type: pandas.CSVDataSet
	filepath: data/01_raw/companies.csv

reviews:
	type: pandas.CSVDataSet
	filepath: data/01_raw/reviews.csv
excelファイルの記述方法は以下の通りです。
shuttles:
	type: pandas.ExcelDataSet
	filepath: data/01_raw/shuttles.xlsx
	load_args:
	engine: openpyxl# Use modern Excel engine (the default since Kedro 0.18.0)
正しく設定できたか確認をしてみます。kedro ipythonというコンソールから以下のように確認します。
kedro ipython
companies = catalog.load("companies")
companies.head()
kedro ipythonはexit()と打ち抜けます。
2.5 前処理pipelineの構築
パイプラインのテンプレートを作成します。テンプレート名は任意で結構ですが、ここでは[data_processing]とします。
kedro pipeline create data_processing上記を実行すると[プロジェクト名フォルダルト]/src/spaceflights/pipelines/data_processing 内に以下2つのPythonファイルができます。
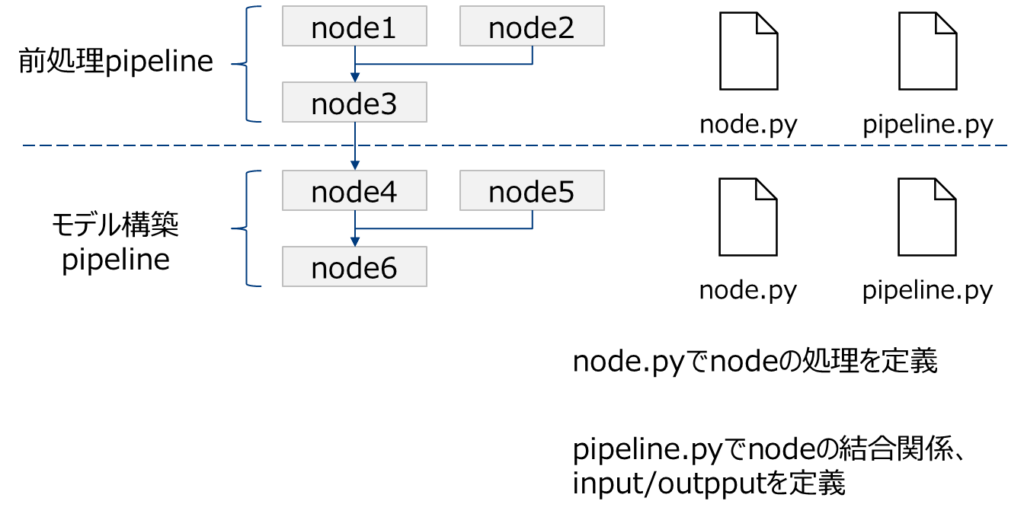
- nodes.py:データ処理を形成するノード関数用
- pipeline.py:パイプラインを構築するためのもの
C:.
├─conf
│  ├─base
│  │  └─parameters
│  └─local
├─data
│  ├─01_raw
│  ├─02_intermediate
│  ├─03_primary
│  ├─04_feature
│  ├─05_model_input
│  ├─06_models
│  ├─07_model_output
│  └─08_reporting
├─docs
│  └─source
├─logs
├─notebooks
└─src
    ├─spaceflights
    │  ├─pipelines
    │  │  ├─data_processing
    │  │  └─__pycache__
    │  └─__pycache__
    └─tests
        └─pipelines
            └─data_processing
さらにパイプラインを実行する際に使用するパラメータを定義するためのyamlファイルが [プロジェクト名フォルダルート]/conf/base/parameters/data_processing.yml に作成されます。
node.Pyとpipeline.pyという2つのファイルでpiplineを定義します。前処理pipelineとモデル構築pipelineそれぞれで2つのファイルが必要です。

2.5.1 node.py
まずnodes.pyに使用する関数を定義していきます。
import pandas as pd


def _is_true(x: pd.Series) -> pd.Series:
    return x == "t"


def _parse_percentage(x: pd.Series) -> pd.Series:
    x = x.str.replace("%", "")
    x = x.astype(float) / 100
    return x


def _parse_money(x: pd.Series) -> pd.Series:
    x = x.str.replace("$", "").str.replace(",", "")
    x = x.astype(float)
    return x


def preprocess_companies(companies: pd.DataFrame) -> pd.DataFrame:
    """Preprocesses the data for companies.

    Args:
        companies: Raw data.
    Returns:
        Preprocessed data, with `company_rating` converted to a float and
        `iata_approved` converted to boolean.
    """
    companies["iata_approved"] = _is_true(companies["iata_approved"])
    companies["company_rating"] = _parse_percentage(companies["company_rating"])
    return companies


def preprocess_shuttles(shuttles: pd.DataFrame) -> pd.DataFrame:
    """Preprocesses the data for shuttles.

    Args:
        shuttles: Raw data.
    Returns:
        Preprocessed data, with `price` converted to a float and `d_check_complete`,
        `moon_clearance_complete` converted to boolean.
    """
    shuttles["d_check_complete"] = _is_true(shuttles["d_check_complete"])
    shuttles["moon_clearance_complete"] = _is_true(shuttles["moon_clearance_complete"])
    shuttles["price"] = _parse_money(shuttles["price"])
    return shuttles

def create_model_input_table(
    shuttles: pd.DataFrame, companies: pd.DataFrame, reviews: pd.DataFrame
) -> pd.DataFrame:
    """Combines all data to create a model input table.

    Args:
        shuttles: Preprocessed data for shuttles.
        companies: Preprocessed data for companies.
        reviews: Raw data for reviews.
    Returns:
        model input table.

    """
    rated_shuttles = shuttles.merge(reviews, left_on="id", right_on="shuttle_id")
    model_input_table = rated_shuttles.merge(
        companies, left_on="company_id", right_on="id"
    )
    model_input_table = model_input_table.dropna()
    return model_input_table
2.5.2 pipeline.py
次にpipeline.pyを記述していきます。2行目でnodes.pyで定義した関数をimportしています。
from kedro.pipeline import Pipeline, node, pipeline
from .nodes import create_model_input_table, preprocess_companies, preprocess_shuttles

def create_pipeline(**kwargs) -> Pipeline:
    return pipeline(
        [
            node(
                func=preprocess_companies,
                inputs="companies",
                outputs="preprocessed_companies",
                name="preprocess_companies_node",
            ),
            node(
                func=preprocess_shuttles,
                inputs="shuttles",
                outputs="preprocessed_shuttles",
                name="preprocess_shuttles_node",
            ),
						node(
						    func=create_model_input_table,
						    inputs=["preprocessed_shuttles", "preprocessed_companies", "reviews"],
						    outputs="model_input_table",
						    name="create_model_input_table_node",
						),
        ]
    )
2.5.3 中間データの保存
データが巨大な場合、モデル構築のたびに前処理を行うのは非効率です。そのため、モデル構築用のデータセットができたら、なるべく保存しておくと便利です。Kedroは、pipelineごとに実行が可能なため、保存しておいたデータセットがあれば、それを入力として、モデル構築pipelineだけを実行することができます。つまり、ドミノのストッパーのような役割を果たします。
conf/base/catalog.ymlにpipelineの出力名を以下のように指定すると、出力データを指定フォルダに保存できます。
model_input_table:
	type: pandas.CSVDataSet
	filepath: data/03_primary/model_input_table.csv
この例ではcsvファイルで出力していますが、pickleファイルでも可能です。なお公式HPのチュートリアルでは[pandas.ParquetDataSet]という形式で保存していますが、この形式の場合エラーがでるかもしれません。その時は
pip isntall kedro[pandas]とanacondaプロンプトからインストールしてください。
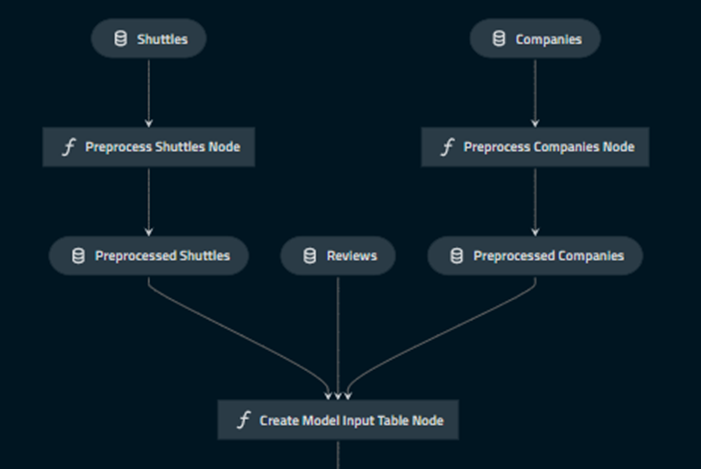
2.6 ここまでのpipelineを可視化
Kedro-vizをインストールします。
pip install kedro-viz
kedro viz
上記を入力すると、ブラウザが立ち上がり、以下のように可視化できます。

2.7 モデリングパイプライン作成
2.7.1 パイプライン作成
モデル作成のパイプラインを作成します。任意の名前で結構なのですが、ここではdata_sicenceという名前にします。
kedro pipeline create data_science2.6 と同様に、src/spaceflights/pipelines/data_science 以下にnodes.pyとpipeline.pyができます。
C:.
├─conf
│  ├─base
│  │  └─parameters
│  └─local
├─data
│  ├─01_raw
│  ├─02_intermediate
│  ├─03_primary
│  ├─04_feature
│  ├─05_model_input
│  ├─06_models
│  │  └─regressor.pickle
│  │      └─2023-04-13T04.45.45.468Z
│  ├─07_model_output
│  └─08_reporting
├─docs
│  └─source
├─logs
├─notebooks
└─src
├─spaceflights
│  ├─pipelines
│  │  ├─data_processing
│  │  │  └─__pycache__
│  │  ├─data_science
│  │  │  └─__pycache__
│  │  └─__pycache__
│  └─__pycache__
└─tests
└─pipelines
├─data_processing
└─data_science
nodes.pyファイルに以下のコードを追記します。
import logging
from typing import Dict, Tuple

import pandas as pd
from sklearn.linear_model import LinearRegression
from sklearn.metrics import r2_score
from sklearn.model_selection import train_test_split


def split_data(data: pd.DataFrame, parameters: Dict) -> Tuple:
    """Splits data into features and targets training and test sets.

    Args:
        data: Data containing features and target.
        parameters: Parameters defined in parameters/data_science.yml.
    Returns:
        Split data.
    """
    X = data[parameters["features"]]
    y = data["price"]
    X_train, X_test, y_train, y_test = train_test_split(
        X, y, test_size=parameters["test_size"], random_state=parameters["random_state"]
    )
    return X_train, X_test, y_train, y_test


def train_model(X_train: pd.DataFrame, y_train: pd.Series) -> LinearRegression:
    """Trains the linear regression model.

    Args:
        X_train: Training data of independent features.
        y_train: Training data for price.

    Returns:
        Trained model.
    """
    regressor = LinearRegression()
    regressor.fit(X_train, y_train)
    return regressor


def evaluate_model(
    regressor: LinearRegression, X_test: pd.DataFrame, y_test: pd.Series
):
    """Calculates and logs the coefficient of determination.

    Args:
        regressor: Trained model.
        X_test: Testing data of independent features.
        y_test: Testing data for price.
    """
    y_pred = regressor.predict(X_test)
    score = r2_score(y_test, y_pred)
    logger = logging.getLogger(__name__)
    logger.info("Model has a coefficient R^2 of %.3f on test data.", score)
2.7.2 inputsパラメータの設定
モデル構築pipelineでは、パラメータリストを引数として与えるような仕様にしています。外部でパラメータリストを定義することで、pipeline自体を変えることなくパラメータだけ変更することが可能です。
上記コードでは関数split_dataの引数として外部パラメータ(parameters)を与えています。その定義をconf/base/parameters/data_science.ymlに追記します。ここで定義した名前(model_optionsという名前)をpipeline.pyで指定します。
model_options:
  test_size: 0.2
  random_state: 3
  features:
    - engines
    - passenger_capacity
    - crew
    - d_check_complete
    - moon_clearance_complete
    - iata_approved
    - company_rating
    - review_scores_rating
2.7.3 パイプラインの組み立て
次に、pipeline.pyを編集します。src/spaceflights/pipelines/data_science/pipeline.pyファイルに以下を追記します。
from kedro.pipeline import Pipeline, node, pipeline
from .nodes import evaluate_model, split_data, train_model

def create_pipeline(**kwargs) -> Pipeline:
    return pipeline(
        [
            node(
                func=split_data,
                inputs=["model_input_table", "params:model_options"],
                outputs=["X_train", "X_test", "y_train", "y_test"],
                name="split_data_node",
            ),
            node(
                func=train_model,
                inputs=["X_train", "y_train"],
                outputs="regressor",
                name="train_model_node",
            ),
            node(
                func=evaluate_model,
                inputs=["regressor", "X_test", "y_test"],
                outputs=None,
                name="evaluate_model_node",
            ),
        ]
    )
各pipelineのカッコ内のnodeは、nodes.pyで定義されたものに対応しています。また、一番上のnodeであるsplit_dataのinputsの一つであるparamsは、conf/base/parameters/data_science.ymlで定義されたものと対応しています。
2.7.4 モデルを保存するデータセットの登録
conf/base/catalog.ymlに定義を追加し、学習済モデルを保存するデータセットを登録します。versionedをTrueとすることで、実行のたびに新規のpickleファイルが作成されます。
regressor:
  type: pickle.PickleDataSet
  filepath: data/06_models/regressor.pickle
  versioned: true
3. 実行
3.1 run
実行してみます。
kedro run補足
- kedro run —pipeline=****** で******の部分だけ実行可能
- csvで出力したファイルの指定がある場合、input名がcatalog.ymlと別のnodeのoutoutで重複していた場合、csvが優先される?
3.2 可視化
次に全体図を可視化してみましょう。kedro-vizを使います。
kedro vizブラウザが立ち上がりpipelineの全体図が出力されます。
4. その他の機能
前項のkedro vizによるダイヤグラムを、node.pyやpipeline.pyの編集に応じて即座に自動で変更することができます。
kedro viz --autoreloadダイアグラムの画面をブラウザで開いたまま、 node.py や pipeline.py を編集すると、変更が自動的に反映されます。ただし、input/outputの整合性が取れていれば、pythonの文法に間違いがあっても、エラーを吐き出さないため注意が必要です。
データアナリティクスのご相談はCrosstabにお問い合わせください。
無料相談大歓迎です。ご興味ございましたら、お問い合わせはこちらから宜しくお願い致します。

