[想定している読者像]
RobynやlightweightMMMのようなブラックボックスMMMツールではなく、自社でカスタマイズしたMMMツールを構築したい方。広告会社や、事業会社のマーケテイング系のデータサイエンティスト、データアナリストの方。
[コンテンツ属性]
ビジネス:★★☆☆☆
データアナリティクス:★★★★★
エンジニアリング:★★☆☆☆
1. はじめに
1.1 Marketing Mix Modeling (MMM)
Marketing Mix Modeling (MMM)とは広告効果を定量化する技術やフレームワークの総称です。この記事をご覧の皆様にはおなじみの定義かもしれません。この技術を簡単に使用できるツールが最近マーケターの注目を集めています。
1.2 色々なツール
metaのRobynやgoogleのLightweight MMMが代表的です。入力データさえ用意してしまえば、ほんの数行でモデリングとその評価を行います。私の周りではmetaのRobynの方が人気があるようです。
さて今回は上記主要2ツールとは別のMaMiMoというpythonで実装されたMMMライブラリをご紹介します。これはDr. Robert Küblerという個人の方が作成されたものです。1https://dr-robert-kuebler.medium.com/そのためバグや不具合は当然あるという理解のもとご使用下さい。もしバグを見つけたらご本人に連絡してくださいとのことです。
本稿は主に以下のサイトを参考に作成しています。
- https://medium.com/towards-data-science/a-small-python-library-for-marketing-mix-modeling-mamimo-100f31666e18
- https://towardsdatascience.com/an-upgraded-marketing-mix-modeling-in-python-5ebb3bddc1b6
- https://github.com/Garve/mamimo
2. MaMiMo
2.1 概要
sklearnのpiplineやLinerRegressionモジュールにMaMiMo独自の前処理モジュールを組み合わせてパイプラインを構築します。この為sklearnに慣れている方にとっては理解しやすい構造になっています。
carryover(Adstockともいわれたりしますが、saturationと合わせてAdstockという場合もあるようです。)、saturationの形状を定めるパラメータやトレンド、周期性及びイベント(祝日などもここで設定できる)変数を設定することができ、ほぼRobynと同様のインプットを持ちます。
以降の2.2ではとにかく早く使いたいという方向けのQuick startを、本稿以降(いつ書くか不明ですが)で各々のステップで何をしているか解説します。
2.2 Quick start
では早速と言いたいところですが、その前に実行環境を用意します。いつものようにgoogle coloboratoryを使いたいところですが、このライブラリはバージョンが3.9未満のpythonに対応していないため、それが3.7であるgoogle coloboではインストールできません。google colobo自身のpythonを3.9にアップグレードすることも可能ですが、やや面倒であるため今回は自分のローカルPCにインストールしたanacondaで環境を作成します。
2.2.1 環境作成
anacondaプロンプトを立ち上げ以下のように入力してpython3.9の仮想環境を作成し、アクティベートします。
conda create -n [任意の名前] python=3.9
conda activate [任意の名前]
mamimoをインストール
pip install mamimo
jupyrter notebookの立ち上げ
jupyter notebook
2.2.2 ライブラリ読み込み
# ライブラリ読み込み
import pandas as pd
import numpy as np
import seaborn as sns
from mamimo.datasets import load_fake_mmm
import matplotlib.pyplot as plt
# from mamimo.carryover import ExponentialCarryover
# from mamimo.saturation import ExponentialSaturation
from mamimo.linear_model import LinearRegression
from sklearn.compose import ColumnTransformer
from sklearn.pipeline import Pipeline
from scipy.stats import uniform, randint
from sklearn.model_selection import RandomizedSearchCV, TimeSeriesSplit
from mamimo.time_utils import add_time_features, add_date_indicators
from mamimo.time_utils import PowerTrend
from mamimo.carryover import ExponentialCarryover
from mamimo.saturation import ExponentialSaturation
from sklearn.linear_model import LinearRegression
from sklearn.preprocessing import OneHotEncoder
from sklearn.compose import ColumnTransformer
from sklearn.pipeline import Pipeline
from mamimo.analysis import breakdown
from optuna.integration import OptunaSearchCV
from optuna.distributions import UniformDistribution, IntUniformDistribution
from sklearn.base import BaseEstimator, TransformerMixin
from sklearn.utils.validation import check_is_fitted, check_array
from scipy.signal import convolve2d
import scipy.optimize as optimize

sns.set(style='whitegrid',palette='bright')
「ExponentialCarryover」と「ExponentialSaturation」は改良版を使用する(作者のmediumで言及されている)ため上記ではコメントアウトしています。以下のように入力することでこの2つのclassを作成します。
class ExponentialSaturation(BaseEstimator, TransformerMixin):
    def __init__(self, a=1.):
        self.a = a

    def fit(self, X, y=None):
        X = check_array(X)
        self._check_n_features(X, reset=True) # from BaseEstimator
        return self

    def transform(self, X):
        check_is_fitted(self)
        X = check_array(X)
        self._check_n_features(X, reset=False) # from BaseEstimator
        return 1 - np.exp(-self.a*X)
class ExponentialCarryover(BaseEstimator, TransformerMixin):
    def __init__(self, strength=0.5, length=1):
        self.strength = strength
        self.length = length

    def fit(self, X, y=None):
        X = check_array(X)
        self._check_n_features(X, reset=True)
        self.sliding_window_ = (
            self.strength ** np.arange(self.length + 1)
        ).reshape(-1, 1)
        return self

    def transform(self, X: np.ndarray):
        check_is_fitted(self)
        X = check_array(X)
        self._check_n_features(X, reset=False)
        convolution = convolve2d(X, self.sliding_window_)
        if self.length > 0:
            convolution = convolution[: -self.length]
        return convolution
2.2.3 データ読み込み
データはMaMiMoライブラリに付属しているサンプルデータを使用します。
# データ読み込み
data = load_fake_mmm()

# 説明可能と目的変数に分離
X = data.drop(columns=['Sales'])
y = data['Sales']
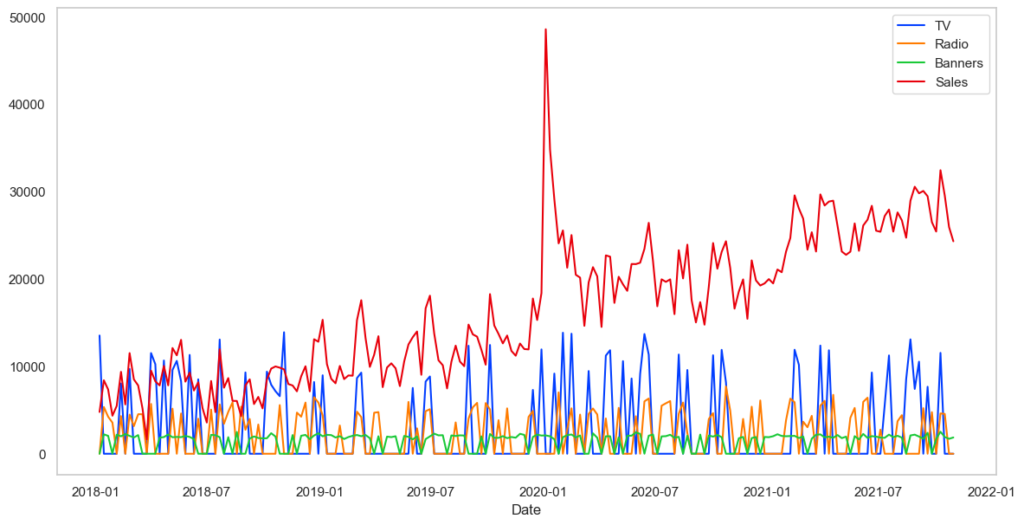
データを確認します。
# 時系列確認
plt.figure(figsize=(14,7))
plt.plot(X,label=X.columns)
plt.plot(y,label=y.name)
plt.legend()
plt.xlabel('Date')
plt.grid()

2.2.3 データ変換
TV、ラジオ、バナーそれぞれのメディア投下費用と時系列変数を説明変数、売上を目的変数として回帰モデルを構築します。そのため以下のように時系列用のカラムを準備します。それぞれ月を表す変数、スパイクした特別日のダミー変数、トレンド項変数です。
X = (X
     .pipe(add_time_features, month=True)
     .pipe(add_date_indicators, special_date=["2020-01-05"])
     .assign(trend=range(200))
)
display(X)

さらにメディア投下費用はcarryover、saturation変換をします(以下の例ではスパイクした日の影響のcarryoverも計算します)。これら一連の処理はsklearnのpiplineを用いています。
# パイプライン作成
cats =  [list(range(1, 13))] # different months, known beforehand

preprocess = ColumnTransformer(
    [
     ('tv_pipe', Pipeline([
            ('carryover', ExponentialCarryover()),
            ('saturation', ExponentialSaturation())
     ]), ['TV']),
     ('radio_pipe', Pipeline([
            ('carryover', ExponentialCarryover()),
            ('saturation', ExponentialSaturation())
     ]), ['Radio']),
     ('banners_pipe', Pipeline([
            ('carryover', ExponentialCarryover()),
            ('saturation', ExponentialSaturation())
     ]), ['Banners']),
    ('month', OneHotEncoder(sparse=False, categories=cats), ['month']),
    ('trend', PowerTrend(), ['trend']),
    ('special_date', ExponentialCarryover(), ['special_date'])
    ]
)

model = Pipeline([
    ('preprocess', preprocess),
    ('regression', LinearRegression(
        positive=True,
        fit_intercept=False) # no intercept because of the months
    )
])
ColumnTransformerを用いることでカラムごとにパイプ処理を行えます。上からTV広告費用をExponentialCarryover()、ExponentialSaturation()と順に変換、次にラジオ広告費用、バナーと繰り返します。次に’month’で始まる行で月をonehotencoding、続いてトレンドを冪変換、最後にスパイクした日(pgm中ではspecial_data)のダミー変数にExponentialCarryover()の変換を行っています。
2.2.4 モデリング
carryover、saturationの構造を決めるハイパーパラメータの調整を行います。ベイズ最適化のツールであるoptunaで行います。(古い方の記事ではRandomizedSearchCVを用いていますが、仕様が異なるため注意してください)
# ハイパーパラメータチューニング
tuned_model = OptunaSearchCV(
    estimator=model,
    param_distributions={
        'preprocess__tv_pipe__carryover__strength': UniformDistribution(0, 1),
        'preprocess__tv_pipe__carryover__length': IntUniformDistribution(0, 6),
        'preprocess__tv_pipe__saturation__a': UniformDistribution(0, 0.01),
        'preprocess__radio_pipe__carryover__strength': UniformDistribution(0, 1),
        'preprocess__radio_pipe__carryover__length': IntUniformDistribution(0, 6),
        'preprocess__radio_pipe__saturation__a': UniformDistribution(0, 0.01),
        'preprocess__banners_pipe__carryover__strength': UniformDistribution(0, 1),
        'preprocess__banners_pipe__carryover__length': IntUniformDistribution(0, 6),
        'preprocess__banners_pipe__saturation__a': UniformDistribution(0, 0.01),
        'preprocess__trend__power': UniformDistribution(0, 2),           # new
        'preprocess__special_date__length': IntUniformDistribution(1, 10),  # new
        'preprocess__special_date__strength': UniformDistribution(0, 1), # new
    },
    n_trials=1000,
    cv=TimeSeriesSplit(),
    random_state=0
)
tuned_model.fit(X, y)
2.2.5 評価
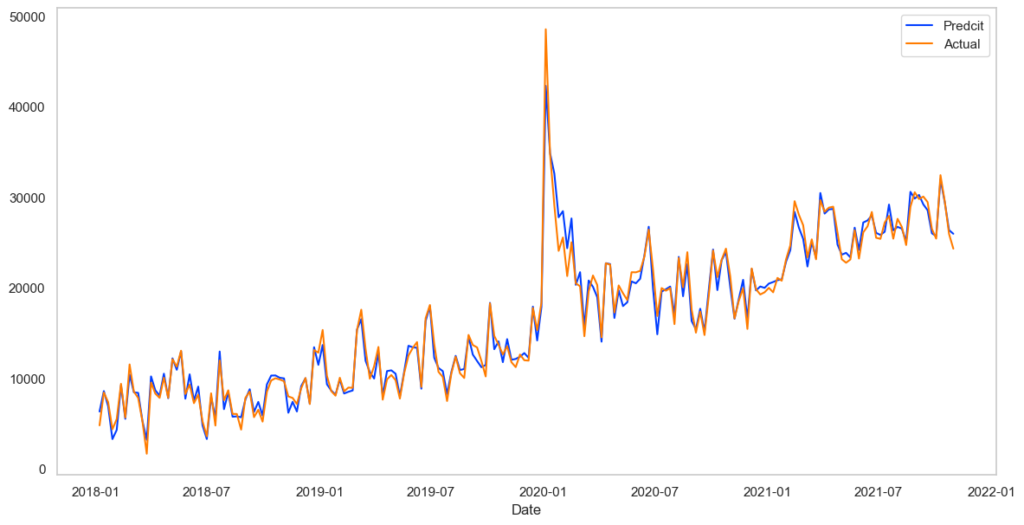
決定係数とあてはまり具合を見てみます。
# 決定係数算出
print(tuned_model.score(X, y))

# 0.9832150910678659
# 時系列予測値確認
preds = tuned_model.predict(X)
plt.figure(figsize=(14,7))
plt.plot(pd.Series(preds,index=X.index),label='Predcit')
plt.plot(y,label='Actual')
plt.legend()
plt.xlabel('Date')
plt.grid()

あてはまりすぎていて怖いくらいです。(まあサンプルデータなので)
次に得られたハイパーパラメータを見てみます。
display (pd.DataFrame.from_dict(tuned_model.best_params_, orient='index'))
# print(tuned_model.best_estimator_.named_steps['regression'].coef_
TVだけ確認しておきましょう。まずstrengthは約0.38より翌週にその効果は約38%になっていることが分かります。またlengthが2であるのでその効果は2週続きます。またsaturation_aは0.000005と他の2つより小さいため、広告費用に対してその効果は他と比較して飽和しにくいということが分かります(後述します)。
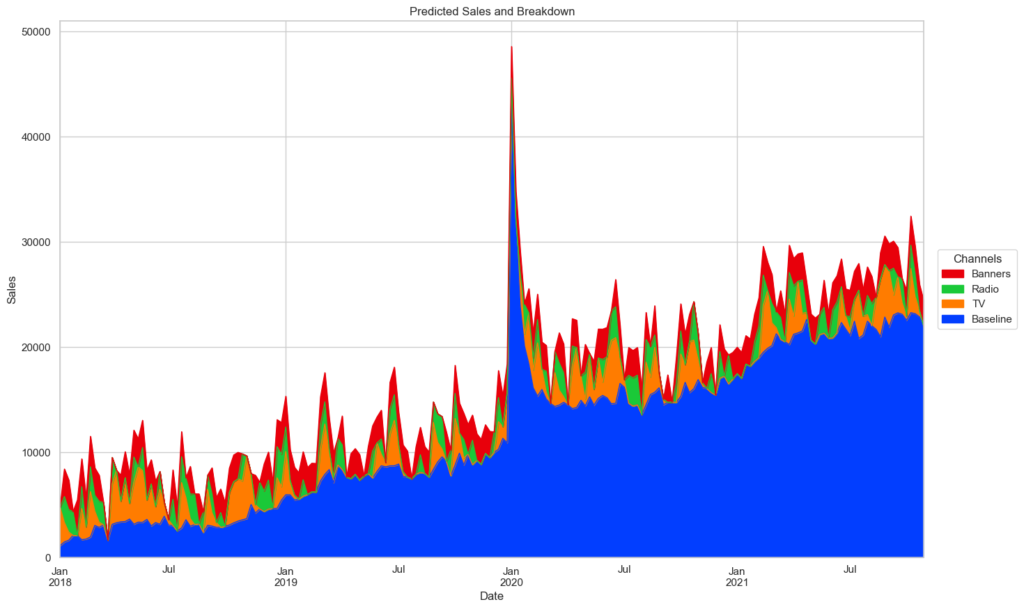
全体の予測に対するそれぞれの寄与を可視化します。
adstock_data = pd.DataFrame(
    tuned_model.best_estimator_.named_steps['preprocess'].transform(X),
    #columns=X.columns,
    index=X.index
)
weights = pd.Series(
    tuned_model.best_estimator_.named_steps['regression'].coef_,
    #index=X.columns
)

base = tuned_model.best_estimator_.named_steps['regression'].intercept_ # 切片なし回帰であるため不要

unadj_contributions = adstock_data.mul(weights).assign(Base=base)
adj_contributions = (unadj_contributions
                     .div(unadj_contributions.sum(axis=1), axis=0)
                     .mul(y, axis=0)
                    )

adj_contributions = pd.concat([adj_contributions.iloc[:,:3],adj_contributions.iloc[:,3:].sum(axis=1)],axis=1)
adj_contributions.columns = list(X.columns[:3]) + ['Baseline']
adj_contributions = adj_contributions[['Baseline','TV', 'Radio', 'Banners']]

ax = (adj_contributions.plot.area(
          figsize=(16, 10),
          linewidth=1,
          title='Predicted Sales and Breakdown',
          ylabel='Sales',
          xlabel='Date'
      )
     )

handles, labels = ax.get_legend_handles_labels()
ax.legend(
    handles[::-1], labels[::-1],
    title='Channels', loc="center left",
    bbox_to_anchor=(1.01, 0.5)
)

Baseline(ほぼトレンド)の影響が寄与の多くを占めているのは一目瞭然です。しかし3つのメディアの違いはこの図からははっきり分りません。
投下広告費用を考慮したROIを計算してみます。
# ROIを計算する
for channel in ['TV', 'Radio', 'Banners']:
    roi = adj_contributions[channel].sum() / X[channel].sum()
    print(f'{channel}: {roi:.2f}')

# TV: 0.55
# Radio: 0.47
# Banners: 1.30
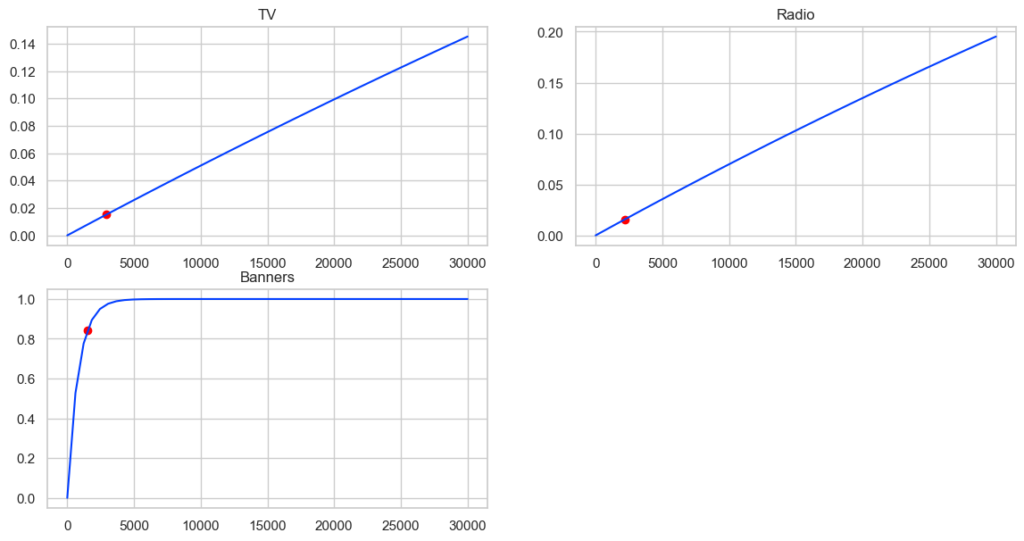
2018年の1月からの200週分のデータによると、バナー広告の費用対効果が最も良かったということが分かります。従って今後の出稿はバナー広告に全て広告費用を寄せれば良いという結論になりそうですが、そうはなりません。このことを投下広告料とsaturation effectの関係から確認しましょう。投下広告とsaturation effectの関係を図示します。
plt.figure(figsize=(14,7))
# TV
plt.subplot(2,2,1)
s = tuned_model.best_estimator_.named_steps.preprocess.named_transformers_.tv_pipe.named_steps.saturation.fit_transform(
np.array(np.linspace(0,30000)).reshape(-1,1))
plt.plot(np.linspace(0,30000), s)

tmp = np.array(X.mean()['TV']).reshape(-1,1)
tmp2 = tuned_model.best_estimator_.named_steps.preprocess.named_transformers_.tv_pipe.named_steps.saturation.fit_transform(tmp)
plt.scatter(tmp, tmp2, color='red')

plt.title('TV')
# radio
plt.subplot(2,2,2)
s = tuned_model.best_estimator_.named_steps.preprocess.named_transformers_.radio_pipe.named_steps.saturation.fit_transform(
np.array(np.linspace(0,30000).reshape(-1,1)))
plt.plot(np.linspace(0,30000), s)

tmp = np.array(X.mean()['Radio']).reshape(-1,1)
tmp2 = tuned_model.best_estimator_.named_steps.preprocess.named_transformers_.radio_pipe.named_steps.saturation.fit_transform(tmp)
plt.scatter(tmp, tmp2, color='red')

plt.title('Radio')
# banners
plt.subplot(2,2,3)
s = tuned_model.best_estimator_.named_steps.preprocess.named_transformers_.banners_pipe.named_steps.saturation.fit_transform(
np.array(np.linspace(0,30000).reshape(-1,1)))
plt.plot(np.linspace(0,30000), s)

tmp = np.array(X.mean()['Banners']).reshape(-1,1)
tmp2 = tuned_model.best_estimator_.named_steps.preprocess.named_transformers_.banners_pipe.named_steps.saturation.fit_transform(tmp)
plt.scatter(tmp, tmp2, color='red')

plt.title('Banners')

かなり大胆に言ってしまえば、出稿額に対する点における曲線の傾きがその広告の費用対効果です。赤色の点が今回のデータの各メディアの平均出稿値で、それぞれの赤点の曲線の傾きを比較するとバナーが最も大きいことが分かります。これは先のROI分析の結果と辻褄があっています。一方でバナー広告費用を増やしていくとある値(ここでは5,000あたり)から傾きがほぼ0になるため、広告費全額をバナーに寄せれば良いとはならないわけです。
2.2.6 最適化
今回使用したデータの最終日の翌日の出稿計画を最適化しましょう。初期値として以下のようなテーブルを作成します。
# 新規データ
X_new = pd.DataFrame({
    'TV': [10000],
    'Radio': [10000],
    'Banners': [10000],
    'month':[10],
    'special_date':[0],
    'trend':[200]
})
最適化はscipy optimizeを使用します。目的関数は2.2.4で学習済のモデルtuned_modelの出力で、制約条件は各々の広告費≥0、各々の広告費の合計=初期条件の広告費の和(つまり上の例では30000)です。目的関数に-1を乗じているのは最大値問題を最小値問題に変えるためです。
# 目的関数定義
def func(x):
    X_ = pd.DataFrame(x,index=['TV', 'Radio', 'Banners']).T
#     temp = pd.DataFrame({
#     'month':[10],
#     'special_date':[0],
#     'trend':[200]
#     })
    temp = X_new.iloc[:,3:]
    X_ = pd.concat([X_, temp],axis=1)
    return(-1*tuned_model.predict(X_))

# 制約条件定義
def con(x):
    return x.sum()-X_new.iloc[:,:3].sum(axis=1) #和が初期値の和と一致
def cons1(x):
    return x[0] # TV>0
def cons2(x):
    return x[1] # Radio>0
def cons3(x):
    return x[2] # Banners>0
cons = [{'type':'eq', 'fun': con},
        {'type':'ineq', 'fun': cons1},
        {'type':'ineq', 'fun': cons2},
        {'type':'ineq', 'fun': cons3}]
実行します。
x0 = np.array(X_new)[0][:3]
res = optimize.minimize(func, x0, constraints=cons)
結果を見ると確かに極大解が得られているようです。
print (res.x)
print (tuned_model.predict(X_new))
print (func(res.x)*-1)

# [-6.41726289e-11  2.82116769e+04  1.78832305e+03]
# [34640.49737278] 最適化前の売上
# [38351.2177477] 最適化後の売上
予算配分の変化を最後に確認しておきましょう。
labels = ['Before', 'Optimized']
width = 0.35       # the width of the bars: can also be len(x) sequence
tv = [X_new.iloc[:,:3]['TV'].values[0], res.x[0]]
radio = [X_new.iloc[:,:3]['Radio'].values[0], res.x[1]]
banners = [X_new.iloc[:,:3]['Banners'].values[0], res.x[2]]

fig, ax = plt.subplots()
ax.bar(labels, tv , width, label='TV')
ax.bar(labels, radio, width, bottom=tv,label='Radio')
ax.bar(labels, banners, width, bottom=np.array(radio) + np.array(tv),label='Banners')
plt.legend()

これでMMMからのアセットアロケーションまでできました。
3. 最後に
MaMiMoは個人が作成した、簡易に実行できかつかつ細かなチューニングも可能なpythonライブラリツールです。しかしあくまで個人の作成ですのでバグや不具合は未知数です。またバグが見つかってもいつ修正されるかわかりません。従ってRorynやgoogleLightweghtMMMと並行して解析し、結果を比較するなどの使い方が良さそうです。
MMMのご相談はぜひ弊社までお問い合わせください。
無料相談大歓迎です。ご興味ございましたら、お問い合わせはこちらから宜しくお願い致します。

